Per usual the wild card games were not well attended. Games 3 to 4 days after the end of the season are hard to sell tickets for and it is no surprise that FC Dallas mustered 10,279 in the stands while the NY Red Bulls had 15,518 watch the do or die game. This made for an average of 12,899 attendees for the wild card round.
The quarterfinals started off weak but finished well due to teams with great supporters selling out their respective stadiums. A list of attendance for each home match is listed below.
Columbus Crew - 9,040
Real Salt Lake - 20,713
New York Red Bulls - 18,054
FC Dallas - 16,112
DC United - 20,187
New England Revolution - 20,184
Los Angeles Galaxy - 27,000
Seattle Sounders - 38,912
This creates an average of 21,275 for the conference semifinals as a whole. This is above the 2011 conference semifinal average of 20,776 or the 2012 average of 20,690, but it is below the 2013 conference semifinal average of 22,789.11
I fully expect to have four sellouts for the conference finals as there is a two week break for international friendlies. The final four teams are packed with history and there is no doubt the Seattle Sounders and LA Galaxy will pack their respective stadiums as the Sounders experience their first conference final and the LA Galaxy supporters may see Landon Donovan play for the final time. The NE Revolution should have no problem selling out their part of Gillette Stadium as their supporters have proved vital in the playoffs traveling to away games and packing the stands in the conference semifinals. NY will be the hardest to sell out as New Jersey for soccer never is as appealing as the football games that are on TV during the weekend.
It will be an exciting finish to the playoffs with plenty of great story lines.
Tuesday, November 11, 2014
Sunday, October 26, 2014
2014 Final Attendance Update
| Team | 2014 Average Attendance | Capacity | Percent Full | 2013 Average Attendance | % Change from 2013 |
| Chicago Fire | 16,076 | 20,000 | 80.38% | 15,228 | +5.57 |
| Chivas USA | 7,063 | 18,800 | 37.57% | 8,366 | -15.58 |
| Colorado Rapids | 15,082 | 17,424 | 86.56% | 15,440 | -2.32 |
| Columbus Crew | 16,881 | 19,968 | 84.54% | 16,080 | +4.98 |
| DC United | 17,030 | 19,467 | 87.48% | 13,646 | +24.80 |
| FC Dallas | 16,816 | 20,500 | 82.03% | +9.39 | |
| Houston Dynamo | 20,117 | 22,039 | 91.28% | 19,923 | +0.98 |
| Los Angeles Galaxy | 21,258 | 27,000 | 78.73% | 22,152 | -4.03 |
| Montreal Impact | 17,421 | 20,521* | 84.89% | 20,603 | -15.44 |
| NE Revolution | 16,681 | 20,000 | 83.41% | 14,844 | +12.38 |
| New York Red Bulls | 19,421 | 25,189 | 77.10% | 19,461 | -0.20 |
| Philadelphia Union | 17,631 | 18,500 | 95.30% | 17,867 | -1.32 |
| Portland Timbers | 20,806 | 20,674 | 100.64% | 20,674 | +0.64 |
| Real Salt Lake | 20,351 | 20,213 | 100.68% | 19,218 | +5.90 |
| San Jose Earthquakes | 14,947 | 10,525* | 142.01% | 12,765 | +17.09 |
| Seattle Sounders | 43,734 | 38,500* | 113.60% | 44,038 | -0.69 |
| Sporting Kansas City | 20,003 | 18,467 | 108.32% | 19,709 | +1.49 |
| Toronto FC | 22,086 | 21,859 | 101.04% | 18,131 | +21.81 |
| Vancouver Whitecaps | 20,408 | 21,000 | 97.18% | 20,038 | +1.85 |
| Average | 19,148 | 21,087 | 90.81% | 18,608 | +2.90 |
Tuesday, October 21, 2014
Week 31 Attendance Update
| Team | 2014 Average Attendance | Capacity | Percent Full | 2013 Average Attendance | % Change from 2013 |
| Chicago Fire | 15,907 | 20,000 | 79.54% | 15,228 | +4.46 |
| Chivas USA | 7,156 | 18,800 | 38.06% | 8,366 | -14.47 |
| Colorado Rapids | 15,082 | 17,424 | 86.56% | 15,440 | -2.32 |
| Columbus Crew | 16,880 | 19,968 | 84.54% | 16,080 | +4.98 |
| DC United | 17,030 | 19,467 | 87.48% | 13,646 | +24.80 |
| FC Dallas | 16,791 | 20,500 | 81.91% | +9.22 | |
| Houston Dynamo | 20,117 | 22,039 | 91.28% | 19,923 | +0.98 |
| Los Angeles Galaxy | 21,258 | 27,000 | 78.73% | 22,152 | -4.03 |
| Montreal Impact | 17,557 | 20,521* | 85.56% | 20,603 | -14.78 |
| NE Revolution | 15,676 | 20,000 | 78.38% | 14,844 | +5.61 |
| New York Red Bulls | 19,421 | 25,189 | 77.10% | 19,461 | -0.20 |
| Philadelphia Union | 17,631 | 18,500 | 95.30% | 17,867 | -1.32 |
| Portland Timbers | 20,806 | 20,674 | 100.64% | 20,674 | +0.64 |
| Real Salt Lake | 20,332 | 20,213 | 100.59% | 19,218 | +5.79 |
| San Jose Earthquakes | 14,947 | 10,525* | 142.01% | 12,765 | +17.09 |
| Seattle Sounders | 42,863 | 38,500* | 111.33% | 44,038 | -2.67 |
| Sporting Kansas City | 20,054 | 18,467 | 108.60% | 19,709 | +1.75 |
| Toronto FC | 22,086 | 21,859 | 101.04% | 18,131 | +21.81 |
| Vancouver Whitecaps | 20,371 | 21,000 | 97.01% | 20,038 | +1.66 |
| Average | 19,041 | 21,087 | 90.30% | 18,608 | +2.33 |
Monday, October 13, 2014
Week 30 Attendance Update
| Team | 2014 Average Attendance | Capacity | Percent Full | 2013 Average Attendance | % Change from 2013 |
| Chicago Fire | 15,907 | 20,000 | 79.54% | 15,228 | +4.46 |
| Chivas USA | 7,156 | 18,800 | 38.06% | 8,366 | -14.47 |
| Colorado Rapids | 15,070 | 17,424 | 86.49% | 15,440 | -2.40 |
| Columbus Crew | 16,880 | 19,968 | 84.54% | 16,080 | +4.98 |
| DC United | 16,834 | 19,467 | 86.47% | 13,646 | +23.36 |
| FC Dallas | 16,791 | 20,500 | 81.91% | +9.22 | |
| Houston Dynamo | 19,979 | 22,039 | 90.65% | 19,923 | +0.28 |
| Los Angeles Galaxy | 20,884 | 27,000 | 77.35% | 22,152 | -5.72 |
| Montreal Impact | 17,557 | 20,521* | 85.56% | 20,603 | -14.78 |
| NE Revolution | 15,676 | 20,000 | 78.38% | 14,844 | +5.61 |
| New York Red Bulls | 19,342 | 25,189 | 76.79% | 19,461 | -0.61 |
| Philadelphia Union | 17,604 | 18,500 | 95.15% | 17,867 | -1.47 |
| Portland Timbers | 20,805 | 20,674 | 100.63% | 20,674 | +0.63 |
| Real Salt Lake | 20,332 | 20,213 | 100.59% | 19,218 | +5.79 |
| San Jose Earthquakes | 15,223 | 10,525* | 144.64% | 12,765 | +19.26 |
| Seattle Sounders | 42,863 | 38,500* | 111.33% | 44,038 | -2.67 |
| Sporting Kansas City | 20,054 | 18,467 | 108.60% | 19,709 | +1.75 |
| Toronto FC | 22,321 | 21,859 | 102.11% | 18,131 | +23.11 |
| Vancouver Whitecaps | 20,330 | 21,000 | 96.81% | 20,038 | +1.45 |
| Average | 19,028 | 21,087 | 90.24% | 18,608 | +2.25 |
Sunday, October 5, 2014
Week 29 Attendance Update
| Team | 2014 Average Attendance | Capacity | Percent Full | 2013 Average Attendance | % Change from 2013 |
| Chicago Fire | 15,907 | 20,000 | 79.54% | 15,228 | +4.46 |
| Chivas USA | 7,297 | 18,800 | 38.82% | 8,366 | -12.77 |
| Colorado Rapids | 15,070 | 17,424 | 86.49% | 15,440 | -2.40 |
| Columbus Crew | 16,880 | 19,968 | 84.54% | 16,080 | +4.98 |
| DC United | 16,834 | 19,467 | 86.47% | 13,646 | +23.36 |
| FC Dallas | 16,641 | 20,500 | 81.17% | +8.25 | |
| Houston Dynamo | 19,853 | 22,039 | 90.08% | 19,923 | -0.35 |
| Los Angeles Galaxy | 20,884 | 27,000 | 77.35% | 22,152 | -5.72 |
| Montreal Impact | 17,769 | 20,521* | 86.59% | 20,603 | -13.76 |
| NE Revolution | 15,676 | 20,000 | 78.38% | 14,844 | +5.61 |
| New York Red Bulls | 19,027 | 25,189 | 75.54% | 19,461 | -2.23 |
| Philadelphia Union | 17,721 | 18,500 | 95.79% | 17,867 | -0.87 |
| Portland Timbers | 20,805 | 20,674 | 100.63% | 20,674 | +0.63 |
| Real Salt Lake | 20,307 | 20,213 | 100.47% | 19,218 | +5.67 |
| San Jose Earthquakes | 15,223 | 10,525* | 144.64% | 12,765 | +19.26 |
| Seattle Sounders | 42,003 | 38,500* | 109.10% | 44,038 | -4.62 |
| Sporting Kansas City | 20,129 | 18,467 | 109.00% | 19,709 | +2.13 |
| Toronto FC | 22,591 | 21,859 | 103.35% | 18,131 | +24.60 |
| Vancouver Whitecaps | 20,330 | 21,000 | 96.81% | 20,038 | +1.45 |
| Average | 18,941 | 21,087 | 89.82% | 18,608 | +1.79 |
Sunday, September 28, 2014
Week 28 Attendance
| Team | 2014 Average Attendance | Capacity | Percent Full | 2013 Average Attendance | % Change from 2013 |
| Chicago Fire | 15,773 | 20,000 | 78.87% | 15,228 | +3.58 |
| Chivas USA | 6,942 | 18,800 | 36.93% | 8,366 | -17.02 |
| Colorado Rapids | 14,900 | 17,424 | 85.52% | 15,440 | -3.50 |
| Columbus Crew | 16,880 | 19,968 | 84.54% | 16,080 | +4.98 |
| DC United | 16,669 | 19,467 | 85.63% | 13,646 | +22.15 |
| FC Dallas | 16,641 | 20,500 | 81.17% | +8.25 | |
| Houston Dynamo | 19,853 | 22,039 | 90.08% | 19,923 | -0.35 |
| Los Angeles Galaxy | 20,672 | 27,000 | 76.56% | 22,152 | -6.68 |
| Montreal Impact | 17,769 | 20,521* | 86.59% | 20,603 | -13.76 |
| NE Revolution | 15,178 | 20,000 | 75.89% | 14,844 | +2.25 |
| New York Red Bulls | 18,846 | 25,189 | 74.82% | 19,461 | -3.16 |
| Philadelphia Union | 17,926 | 18,500 | 96.90% | 17,867 | +0.33 |
| Portland Timbers | 20,805 | 20,674 | 100.63% | 20,674 | +0.63 |
| Real Salt Lake | 20,307 | 20,213 | 100.47% | 19,218 | +5.67 |
| San Jose Earthquakes | 15,537 | 10,525* | 147.62% | 12,765 | +21.71 |
| Seattle Sounders | 42,003 | 38,500* | 109.10% | 44,038 | -4.62 |
| Sporting Kansas City | 20,129 | 18,467 | 109.00% | 19,709 | +2.13 |
| Toronto FC | 22,591 | 21,859 | 103.35% | 18,131 | +24.60 |
| Vancouver Whitecaps | 20,340 | 21,000 | 96.86% | 20,038 | +1.51 |
| Average | 18,969 | 21,087 | 89.96% | 18,608 | +1.94 |
Sunday, September 21, 2014
Week 27 Attendance Update
| Team | 2014 Average Attendance | Capacity | Percent Full | 2013 Average Attendance | % Change from 2013 |
| Chicago Fire | 15,773 | 20,000 | 78.87% | 15,228 | +3.58 |
| Chivas USA | 6,492 | 18,800 | 36.93% | 8,366 | -17.02 |
| Colorado Rapids | 14,848 | 17,424 | 85.21% | 15,440 | -3.84 |
| Columbus Crew | 16,651 | 19,968 | 83.39% | 16,080 | +3.55 |
| DC United | 16,468 | 19,467 | 84.60% | 13,646 | +20.68 |
| FC Dallas | 16,786 | 20,500 | 81.88% | +9.19 | |
| Houston Dynamo | 19,824 | 22,039 | 89.95% | 19,923 | -0.50 |
| Los Angeles Galaxy | 20,356 | 27,000 | 75.39% | 22,152 | -8.11 |
| Montreal Impact | 17,769 | 20,521* | 86.59% | 20,603 | -13.76 |
| NE Revolution | 15,178 | 20,000 | 75.89% | 14,844 | +2.25 |
| New York Red Bulls | 18,846 | 25,189 | 74.82% | 19,461 | -3.16 |
| Philadelphia Union | 17,926 | 18,500 | 96.90% | 17,867 | +0.33 |
| Portland Timbers | 20,805 | 20,674 | 100.63% | 20,674 | +0.63 |
| Real Salt Lake | 20,307 | 20,213 | 100.47% | 19,218 | +5.67 |
| San Jose Earthquakes | 15,537 | 10,525* | 147.62% | 12,765 | +21.71 |
| Seattle Sounders | 42,238 | 38,500* | 109.71% | 44,038 | -4.09 |
| Sporting Kansas City | 20,172 | 18,467 | 109.23% | 19,709 | +2.35 |
| Toronto FC | 22,591 | 21,859 | 103.35% | 18,131 | +24.60 |
| Vancouver Whitecaps | 20,413 | 21,000 | 97.20% | 20,038 | +1.87 |
| Average | 18,874 | 21,087 | 89.51% | 18,608 | +1.43 |
Monday, September 15, 2014
Week 26 Attendance Update
| Team | 2014 Average Attendance | Capacity | Percent Full | 2013 Average Attendance | % Change from 2013 |
| Chicago Fire | 15,666 | 20,000 | 78.33% | 15,228 | +2.88 |
| Chivas USA | 6,492 | 18,800 | 36.93% | 8,366 | -17.02 |
| Colorado Rapids | 14,848 | 17,424 | 85.21% | 15,440 | -3.84 |
| Columbus Crew | 16,318 | 19,968 | 81.72% | 16,080 | +1.48 |
| DC United | 16,468 | 19,467 | 84.60% | 13,646 | +20.68 |
| FC Dallas | 16,786 | 20,500 | 81.88% | +9.19 | |
| Houston Dynamo | 19,824 | 22,039 | 89.95% | 19,923 | -0.50 |
| Los Angeles Galaxy | 20,163 | 27,000 | 74.68% | 22,152 | -8.98 |
| Montreal Impact | 17,909 | 20,521* | 87.27% | 20,603 | -13.08 |
| NE Revolution | 15,178 | 20,000 | 75.89% | 14,844 | +2.25 |
| New York Red Bulls | 18,372 | 25,189 | 72.94% | 19,461 | -5.59 |
| Philadelphia Union | 17,885 | 18,500 | 96.68% | 17,867 | +0.10 |
| Portland Timbers | 20,804 | 20,674 | 100.63% | 20,674 | +0.63 |
| Real Salt Lake | 20,280 | 20,213 | 100.33% | 19,218 | +5.52 |
| San Jose Earthquakes | 15,537 | 10,525* | 147.62% | 12,765 | +21.71 |
| Seattle Sounders | 42,238 | 38,500* | 109.71% | 44,038 | -4.09 |
| Sporting Kansas City | 20,172 | 18,467 | 109.23% | 19,709 | +2.35 |
| Toronto FC | 22,591 | 21,859 | 103.35% | 18,131 | +24.60 |
| Vancouver Whitecaps | 20,413 | 21,000 | 97.20% | 20,038 | +1.87 |
| Average | 18,817 | 21,087 | 89.24% | 18,608 | +1.12 |
Monday, September 8, 2014
Week 25 Attendance Update
| Team | 2014 Average Attendance | Capacity | Percent Full | 2013 Average Attendance | % Change from 2013 |
| Chicago Fire | 15,433 | 20,000 | 77.17% | 15,228 | +1.35 |
| Chivas USA | 7,173 | 18,800 | 38.16% | 8,366 | -14.25 |
| Colorado Rapids | 14,760 | 17,424 | 84.71% | 15,440 | -4.40 |
| Columbus Crew | 16,318 | 19,968 | 81.72% | 16,080 | +1.48 |
| DC United | 16,468 | 19,467 | 84.60% | 13,646 | +20.68 |
| FC Dallas | 16,786 | 20,500 | 81.88% | +9.19 | |
| Houston Dynamo | 19,748 | 22,039 | 89.60% | 19,923 | -0.88 |
| Los Angeles Galaxy | 20,163 | 27,000 | 74.68% | 22,152 | -8.98 |
| Montreal Impact | 18,216 | 20,521* | 88.77% | 20,603 | -11.58 |
| NE Revolution | 14,858 | 20,000 | 74.29% | 14,844 | +0.09 |
| New York Red Bulls | 18,657 | 25,189 | 74.07% | 19,461 | -4.13 |
| Philadelphia Union | 17,868 | 18,500 | 96.58% | 17,867 | +0.01 |
| Portland Timbers | 20,804 | 20,674 | 100.63% | 20,674 | +0.63 |
| Real Salt Lake | 20,280 | 20,213 | 100.33% | 19,218 | +5.52 |
| San Jose Earthquakes | 15,895 | 10,525* | 151.02% | 12,765 | +24.52 |
| Seattle Sounders | 42,489 | 38,500* | 110.36% | 44,038 | -3.52 |
| Sporting Kansas City | 20,172 | 18,467 | 109.23% | 19,709 | +2.35 |
| Toronto FC | 22,591 | 21,859 | 103.35% | 18,131 | +24.60 |
| Vancouver Whitecaps | 20,682 | 21,000 | 98.48% | 20,038 | +3.21 |
| Average | 18,882 | 21,087 | 89.54% | 18,608 | +1.47 |
Sunday, August 24, 2014
Week 23 Attendance Update
| Team | 2014 Average Attendance | Capacity | Percent Full | 2013 Average Attendance | % Change from 2013 |
| Chicago Fire | 15,317 | 20,000 | 76.59% | 15,228 | +0.59 |
| Chivas USA | 6,417 | 18,800 | 34.13% | 8,366 | -23.30 |
| Colorado Rapids | 14,760 | 17,424 | 84.71% | 15,440 | -4.40 |
| Columbus Crew | 16,262 | 19,968 | 81.44% | 16,080 | +1.13 |
| DC United | 16,239 | 19,467 | 83.42% | 13,646 | +19.00 |
| FC Dallas | 16,786 | 20,500 | 81.88% | +9.19 | |
| Houston Dynamo | 19,852 | 22,039 | 90.08% | 19,923 | -0.36 |
| Los Angeles Galaxy | 20,721 | 27,000 | 76.74% | 22,152 | -6.46 |
| Montreal Impact | 18,401 | 20,521* | 89.67% | 20,603 | -10.69 |
| NE Revolution | 15,342 | 20,000 | 76.71% | 14,844 | +3.35 |
| New York Red Bulls | 18,460 | 25,189 | 73.28% | 19,461 | -5.15 |
| Philadelphia Union | 18,107 | 18,500 | 97.88% | 17,867 | +1.34 |
| Portland Timbers | 20,803 | 20,674 | 100.63% | 20,674 | +0.63 |
| Real Salt Lake | 20,259 | 20,213 | 100.23% | 19,218 | +5.42 |
| San Jose Earthquakes | 16,308 | 10,525* | 154.94% | 12,765 | +27.75 |
| Seattle Sounders | 42,785 | 38,500* | 111.13% | 44,038 | -2.84 |
| Sporting Kansas City | 20,160 | 18,467 | 109.17% | 19,709 | +2.29 |
| Toronto FC | 22,591 | 21,859 | 103.35% | 18,131 | +24.60 |
| Vancouver Whitecaps | 20,907 | 21,000 | 99.56% | 20,038 | +4.33 |
| Average | 18,948 | 21,087 | 89.86% | 18,608 | +1.83 |
Wednesday, August 20, 2014
Miami Fusion FC Historical Attendance
The Miami Fusion were a part of the first MLS expansion in 1998 with the Chicago Fire. The expansion moved the league to 12 teams and the historically awkward three conferences. One again like the Tampa Bay Mutiny, an uninspired fan base, dwindling ticket sales, and large revenue losses led to the contraction of this MLS franchise. The Fusion were only in the league for four years, and their departure along with the Mutiny in 2001 has left the state of Florida without an MLS team for over a decade. This will change as Orlando City FC is set to join the MLS in 2015.
Lockhart Stadium was renovated in 1998 to be a soccer specific facility with a capacity of 20,450. The Fusion were the first team to play in a soccer specific stadium. The Fusion were only able to muster an average attendance of 9,403 over the four years that they were in the league.
 |
| Lockhart Stadium |
| Year | Average Attendance | Capacity |
| 1998 | 10,284 | 20,450 |
| 1999 | 8,689 | 20,450 |
| 2000 | 7,460 | 20,450 |
| 2001 | 11,177 | 20,450 |
Tuesday, August 19, 2014
Week 22 Attendance Update
| Team | 2014 Average Attendance | Capacity | Percent Full | 2013 Average Attendance | % Change from 2013 |
| Chicago Fire | 15,317 | 20,000 | 76.59% | 15,228 | +0.59 |
| Chivas USA | 6,417 | 18,800 | 34.13% | 8,366 | -23.30 |
| Colorado Rapids | 14,823 | 17,424 | 85.07% | 15,440 | -4.00 |
| Columbus Crew | 16,155 | 19,968 | 80.90% | 16,080 | +0.46 |
| DC United | 16,239 | 19,467 | 83.42% | 13,646 | +19.00 |
| FC Dallas | 16,716 | 20,500 | 81.54% | +8.74 | |
| Houston Dynamo | 19,852 | 22,039 | 90.08% | 19,923 | -0.36 |
| Los Angeles Galaxy | 20,629 | 27,000 | 76.40% | 22,152 | -6.87 |
| Montreal Impact | 18,401 | 20,521* | 89.67% | 20,603 | -10.69 |
| NE Revolution | 15,243 | 20,000 | 76.21% | 14,844 | +2.69 |
| New York Red Bulls | 18,517 | 25,189 | 73.51% | 19,461 | -4.85 |
| Philadelphia Union | 18,176 | 18,500 | 98.25% | 17,867 | +1.73 |
| Portland Timbers | 20,802 | 20,674 | 100.62% | 20,674 | +0.62 |
| Real Salt Lake | 20,259 | 20,213 | 100.23% | 19,218 | +5.42 |
| San Jose Earthquakes | 16,308 | 10,525* | 154.94% | 12,765 | +27.75 |
| Seattle Sounders | 43,138 | 38,500* | 112.05% | 44,038 | -2.04 |
| Sporting Kansas City | 20,176 | 18,467 | 109.26% | 19,709 | +2.37 |
| Toronto FC | 22,591 | 21,859 | 103.35% | 18,131 | +24.60 |
| Vancouver Whitecaps | 20,907 | 21,000 | 99.56% | 20,038 | +4.33 |
| Average | 18,873 | 21,087 | 89.50% | 18,608 | +1.42 |
Sunday, August 17, 2014
Tampa Bay Mutiny Historical Attendance
I have had quite a few followers ask for historical attendance data for each team, so for the next few weeks I will post each team and their attendance over the years since they have joined the MLS.
I will start today with one of the two defunct franchises, the Tampa Bay Mutiny. The Mutiny were one of the original 10 MLS franchises to start in 1996. They had some initial success but lacked support later on as they traded their big name players for little in return. Don Garber was unable to find an owner for the team so the team folded.
They played their first three years in Houlihan's Stadium which had a capacity of 74,301 and was the home of the Tampa Buccaneers. The stadium was reduced to a capacity of 16,000 for soccer games. The final soccer game played in Tampa Stadium featured a crowd of 27,597 as the Mutiny beat the New York MetroStars (now the New York Red Bulls) 2-1.
The Mutiny moved to Raymond James Stadium along with the Buccaneers in 1999. The stadium had a capacity of 66,321 at the time, but once again it was artificially reduced to 32,000 for Mutiny soccer games. Listed is the attendance of all six years that the Mutiny were active in the MLS. They had an overall average of 11,106 over the six years.
 |
| First ever MLS game on ESPN |
They played their first three years in Houlihan's Stadium which had a capacity of 74,301 and was the home of the Tampa Buccaneers. The stadium was reduced to a capacity of 16,000 for soccer games. The final soccer game played in Tampa Stadium featured a crowd of 27,597 as the Mutiny beat the New York MetroStars (now the New York Red Bulls) 2-1.
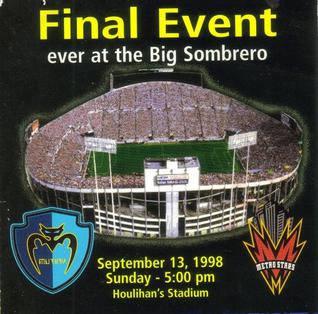 |
| Advertisement for the final game in Houlihan's Stadium |
| Year | Average Attendance | Capacity |
| 1996 | 11,679 | 16,000 |
| 1997 | 11,338 | 16,000 |
| 1998 | 10,312 | 16,000 |
| 1999 | 13,106 | 32,000 |
| 2000 | 9,452 | 32,000 |
| 2001 | 10,479 | 32,000 |
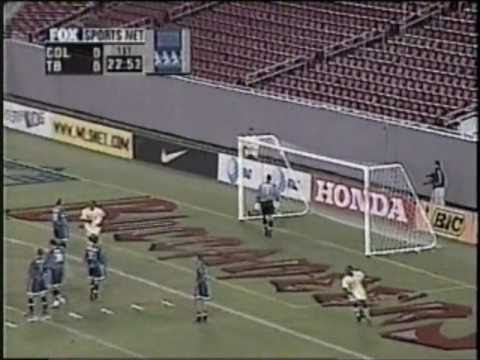 |
| An empty stadium and football lines doomed the franchise |
Thursday, August 14, 2014
Week 21 Attendance Update
| Team | 2014 Average Attendance | Capacity | Percent Full | 2013 Average Attendance | % Change from 2013 |
| Chicago Fire | 15,317 | 20,000 | 76.59% | 15,228 | +0.59 |
| Chivas USA | 6,637 | 18,800 | 35.30% | 8,366 | -20.67 |
| Colorado Rapids | 14,823 | 17,424 | 85.07% | 15,440 | -4.00 |
| Columbus Crew | 15,739 | 19,968 | 78.82% | 16,080 | -2.12 |
| DC United | 16,524 | 19,467 | 84.88% | 13,646 | +21.09 |
| FC Dallas | 16,716 | 20,500 | 81.54% | +8.74 | |
| Houston Dynamo | 19,813 | 22,039 | 89.90% | 19,923 | -0.55 |
| Los Angeles Galaxy | 20,629 | 27,000 | 76.40% | 22,152 | -6.87 |
| Montreal Impact | 18,517 | 20,521* | 90.23% | 20,603 | -10.13 |
| NE Revolution | 15,126 | 20,000 | 75.63% | 14,844 | +1.90 |
| New York Red Bulls | 18,517 | 25,189 | 73.51% | 19,461 | -4.85 |
| Philadelphia Union | 18,176 | 18,500 | 98.25% | 17,867 | +1.73 |
| Portland Timbers | 20,802 | 20,674 | 100.62% | 20,674 | +0.62 |
| Real Salt Lake | 20,240 | 20,213 | 100.14% | 19,218 | +5.32 |
| San Jose Earthquakes | 16,789 | 10,525* | 159.52% | 12,765 | +31.53 |
| Seattle Sounders | 43,138 | 38,500* | 112.05% | 44,038 | -2.04 |
| Sporting Kansas City | 20,126 | 18,467 | 108.98% | 19,709 | +2.12 |
| Toronto FC | 22,591 | 21,859 | 103.35% | 18,131 | +24.60 |
| Vancouver Whitecaps | 20,907 | 21,000 | 99.56% | 20,038 | +4.33 |
| Average | 19,000 | 21,087 | 90.11% | 18,608 | +2.11 |
Columbus Crew Clarification
First off I would like to say thank you very much to the Columbus Crew communications office for reaching out to me and giving
me some data on some discrepancies that you very observant readers have
noticed.

Here are some points that he stated for me in an email that
clarifies the situation. He also includes some cool statistics and historical
data. All of these are official MLS modifications made along with the Columbus Crew.
-
As a point of clarification, the official MLS
attendance for the Columbus Crew vs. FC Dallas match, originally scheduled for
June 28, 2014 and then rescheduled for June 29, 2014 due to extenuating
circumstances, is 20,617.
-
This was an unprecedented situation for both the
Columbus Crew and MLS, and after further dialogue and clarification with the
League, the official ruling on the attendance figure is 20,617, since that was
the number calculated within the League’s standard attendance reporting
structure.
-
This clarification should have been communicated
to the appropriate audiences sooner, but because of the unique nature
surrounding the events that took place the weekend of June 18-29, the
interpretation of this attendance data was delayed.
-
The FC Dallas match is officially classified as
a sellout at Columbus Crew Stadium, the first of the 2014 season. The July 19
match between the Columbus Crew and the Montreal Impact is officially
classified as the second sellout at Crew Stadium for the 2014 season
(attendance of 21,112).
-
The last time the Columbus Crew posted two
sellouts in a single season was during the 2007 campaign. Prior to this season,
the last sellout at Crew Stadium was Saturday, August 31, 2013 against Seattle
Sounders FC.
-
An additional point of clarification is the new
seating capacity at Crew Stadium, which changed at the beginning of the 2014
season from 20,145 to 19,968 due to physical improvements in the east stands
that involved providing more access portals to the lower concourse and
replacing the bench seating with individual chairback seating in the three
center sections of Premier East. These two construction projects reduced the
overall seating capacity in the stadium. It is possible for the club to accommodate
more than 19,968 fans in standing-room areas, such as the north bridge, as was
the case in both of this year’s sellout games.
I updated the attendance a couple weeks ago, but I will now
update the capacity of Crew Stadium. They will most likely have another sellout
this weekend as they have now organized a ceremony for Landon Donovan to honor
his last game in Columbus.

He has had some great moments in Crew Stadium including this
recent “dos a cero” win against Mexico in 2013.
Also sorry for the delay in this week’s attendance. I had to
wait for the FC Dallas attendance to be posted before I could post the weekly
update.
Monday, August 4, 2014
Pre-All Star Game Update
| Team | 2014 Average Attendance | Capacity | Percent Full | 2013 Average Attendance | % Change from 2013 |
| Chicago Fire | 15,245 | 20,000 | 76.23% | 15,228 | +0.11 |
| Chivas USA | 6,637 | 18,800 | 35.30% | 8,366 | -20.67 |
| Colorado Rapids | 14,823 | 17,424 | 85.07% | 15,440 | -4.00 |
| Columbus Crew | 15,530 | 20,145 | 77.09% | 16,080 | -3.42 |
| DC United | 16,524 | 19,467 | 84.88% | 13,646 | +21.09 |
| FC Dallas | 16,806 | 20,500 | 81.98% | +9.32 | |
| Houston Dynamo | 19,813 | 22,039 | 89.90% | 19,923 | -0.55 |
| Los Angeles Galaxy | 20,730 | 27,000 | 76.78% | 22,152 | -6.42 |
| Montreal Impact | 18,517 | 20,521* | 90.23% | 20,603 | -10.13 |
| NE Revolution | 15,126 | 20,000 | 75.63% | 14,844 | +1.90 |
| New York Red Bulls | 18,517 | 25,189 | 73.51% | 19,461 | -4.85 |
| Philadelphia Union | 18,117 | 18,500 | 97.93% | 17,867 | +1.40 |
| Portland Timbers | 20,801 | 20,674 | 100.62% | 20,674 | +0.62 |
| Real Salt Lake | 20,221 | 20,213 | 100.04% | 19,218 | +5.22 |
| San Jose Earthquakes | 16,789 | 10,525* | 159.52% | 12,765 | +31.53 |
| Seattle Sounders | 42,424 | 38,500* | 110.19% | 44,038 | -3.67 |
| Sporting Kansas City | 20,126 | 18,467 | 108.98% | 19,709 | +2.12 |
| Toronto FC | 22,591 | 21,859 | 103.35% | 18,131 | +24.60 |
| Vancouver Whitecaps | 20,987 | 21,000 | 99.94% | 20,038 | +4.74 |
| Average | 18,856 | 21,096 | 89.38% | 18,608 | +1.33 |
Wednesday, July 30, 2014
Week 19 Attendance Update
| Team | 2014 Average Attendance | Capacity | Percent Full | 2013 Average Attendance | % Change from 2013 |
| Chicago Fire | 15,337 | 20,000 | 76.68% | 15,228 | +0.71 |
| Chivas USA | 6,935 | 18,800 | 36.89% | 8,366 | -17.10 |
| Colorado Rapids | 14,575 | 17,424 | 83.65% | 15,440 | -5.61 |
| Columbus Crew | 13,937 | 20,145 | 69.18% | 16,080 | -13.33 |
| DC United | 16,524 | 19,467 | 84.88% | 13,646 | +21.09 |
| FC Dallas | 16,806 | 20,500 | 81.98% | +9.32 | |
| Houston Dynamo | 19,788 | 22,039 | 89.79% | 19,923 | -0.68 |
| Los Angeles Galaxy | 20,811 | 27,000 | 77.08% | 22,152 | -6.06 |
| Montreal Impact | 18,702 | 20,521* | 91.14% | 20,603 | -9.23 |
| NE Revolution | 15,126 | 20,000 | 75.63% | 14,844 | +1.90 |
| New York Red Bulls | 18,256 | 25,189 | 72.48% | 19,461 | -6.19 |
| Philadelphia Union | 18,117 | 18,500 | 97.93% | 17,867 | +1.40 |
| Portland Timbers | 20,801 | 20,674 | 100.62% | 20,674 | +0.62 |
| Real Salt Lake | 20,221 | 20,213 | 100.04% | 19,218 | +5.22 |
| San Jose Earthquakes | 13,883 | 10,525* | 131.90% | 12,765 | +8.75 |
| Seattle Sounders | 42,424 | 38,500* | 110.19% | 44,038 | -3.67 |
| Sporting Kansas City | 20,007 | 18,467 | 108.34% | 19,709 | +1.51 |
| Toronto FC | 22,591 | 21,859 | 103.35% | 18,131 | +24.60 |
| Vancouver Whitecaps | 20,987 | 21,000 | 99.94% | 20,038 | +4.74 |
| Average | 18,700 | 21,096 | 88.64% | 18,608 | +0.49 |
Monday, July 21, 2014
Week 18 Attendance Update
| Team | 2014 Average Attendance | Capacity | Percent Full | 2013 Average Attendance | % Change from 2013 |
| Chicago Fire | 15,537 | 20,000 | 77.69% | 15,228 | +2.03 |
| Chivas USA | 6,935 | 18,800 | 36.89% | 8,366 | -17.10 |
| Colorado Rapids | 14,567 | 17,424 | 83.60% | 15,440 | -5.66 |
| Columbus Crew | 13,937 | 20,145 | 69.18% | 16,080 | -13.33 |
| DC United | 16,556 | 19,467 | 85.05% | 13,646 | +21.33 |
| FC Dallas | 16,806 | 20,500 | 81.98% | +9.32 | |
| Houston Dynamo | 19,788 | 22,039 | 89.79% | 19,923 | -0.68 |
| Los Angeles Galaxy | 20,811 | 27,000 | 77.08% | 22,152 | -6.06 |
| Montreal Impact | 19,145 | 20,521* | 93.29% | 20,603 | -7.08 |
| NE Revolution | 15,361 | 20,000 | 76.81% | 14,844 | +3.48 |
| New York Red Bulls | 18,256 | 25,189 | 72.48% | 19,461 | -6.19 |
| Philadelphia Union | 18,117 | 18,500 | 97.93% | 17,867 | +1.40 |
| Portland Timbers | 20,801 | 20,674 | 100.62% | 20,674 | +0.62 |
| Real Salt Lake | 20,193 | 20,213 | 99.90% | 19,218 | +5.08 |
| San Jose Earthquakes | 14,218 | 10,525* | 135.09% | 12,765 | +11.39 |
| Seattle Sounders | 42,771 | 38,500* | 111.09% | 44,038 | -2.88 |
| Sporting Kansas City | 20,007 | 18,467 | 108.34% | 19,709 | +1.51 |
| Toronto FC | 22,591 | 21,859 | 103.35% | 18,131 | +24.60 |
| Vancouver Whitecaps | 20,985 | 21,000 | 99.93% | 20,038 | +4.73 |
| Average | 18,716 | 21,096 | 88.72% | 18,608 | +0.58 |
Thursday, July 17, 2014
Week 17 Attendance Update
 |
| Sellout at CenturyLink Field in Seattle for the clash between the Sounders and the Timbers |
| Team | 2014 Average Attendance | Capacity | Percent Full | 2013 Average Attendance | % Change from 2013 |
| Chicago Fire | 15,297 | 20,000 | 76.48% | 15,228 | +0.45 |
| Chivas USA | 6,935 | 18,800 | 36.89% | 8,366 | -17.10 |
| Colorado Rapids | 14,567 | 17,424 | 83.60% | 15,440 | -5.66 |
| Columbus Crew | 13,139 | 20,145 | 65.22% | 16,080 | -18.29 |
| DC United | 16,839 | 19,467 | 86.50% | 13,646 | +23.40 |
| FC Dallas | 16,931 | 20,500 | 82.59% | +10.14 | |
| Houston Dynamo | 19,757 | 22,039 | 89.64% | 19,923 | -0.83 |
| Los Angeles Galaxy | 20,811 | 27,000 | 77.08% | 22,152 | -6.06 |
| Montreal Impact | 19,145 | 20,521* | 93.29% | 20,603 | -7.08 |
| NE Revolution | 15,361 | 20,000 | 76.81% | 14,844 | +3.48 |
| New York Red Bulls | 18,038 | 25,189 | 71.61% | 19,461 | -7.31 |
| Philadelphia Union | 18,117 | 18,500 | 97.93% | 17,867 | +1.40 |
| Portland Timbers | 20,800 | 20,674 | 100.61% | 20,674 | +0.61 |
| Real Salt Lake | 20,184 | 20,213 | 99.86% | 19,218 | +5.03 |
| San Jose Earthquakes | 14,218 | 10,525* | 135.09% | 12,765 | +11.39 |
| Seattle Sounders | 42,771 | 38,500* | 111.09% | 44,038 | -2.88 |
| Sporting Kansas City | 19,842 | 18,467 | 107.44% | 19,709 | +0.67 |
| Toronto FC | 22,591 | 21,859 | 103.35% | 18,131 | +24.60 |
| Vancouver Whitecaps | 20,985 | 21,000 | 99.93% | 20,038 | +4.73 |
| Average | 18,704 | 21,096 | 88.66% | 18,608 | +0.51 |
Monday, July 7, 2014
Week 16 Attendance Update
| Team | 2014 Average Attendance | Capacity | Percent Full | 2013 Average Attendance | % Change from 2013 |
| Chicago Fire | 15,297 | 20,000 | 76.48% | 15,228 | +0.45 |
| Chivas USA | 6,935 | 18,800 | 36.89% | 8,366 | -17.10 |
| Colorado Rapids | 14,567 | 17,424 | 83.60% | 15,440 | -5.66 |
| Columbus Crew | 13,076 | 20,145 | 64.91% | 16,080 | -18.68 |
| DC United | 16,839 | 19,467 | 86.50% | 13,646 | +23.40 |
| FC Dallas | 16,931 | 20,500 | 82.59% | +10.14 | |
| Houston Dynamo | 19,757 | 22,039 | 89.64% | 19,923 | -0.83 |
| Los Angeles Galaxy | 21,477 | 27,000 | 79.54% | 22,152 | -3.05 |
| Montreal Impact | 19,394 | 20,521* | 94.51% | 20,603 | -5.87 |
| NE Revolution | 15,355 | 20,000 | 76.77% | 14,844 | +3.44 |
| New York Red Bulls | 18,182 | 25,189 | 72.18% | 19,461 | -6.57 |
| Philadelphia Union | 17,976 | 18,500 | 97.17% | 17,867 | +0.61 |
| Portland Timbers | 20,800 | 20,674 | 100.61% | 20,674 | +0.61 |
| Real Salt Lake | 20,184 | 20,213 | 99.86% | 19,218 | +5.03 |
| San Jose Earthquakes | 14,629 | 10,525* | 138.99% | 12,765 | +14.60 |
| Seattle Sounders | 40,091 | 38,500* | 104.13% | 44,038 | -8.96 |
| Sporting Kansas City | 19,842 | 18,467 | 107.44% | 19,709 | +0.67 |
| Toronto FC | 22,591 | 21,859 | 103.35% | 18,131 | +24.60 |
| Vancouver Whitecaps | 21,214 | 21,000 | 101.02% | 20,038 | +5.87 |
| Average | 18,486 | 21,096 | 87.63% | 18,608 | -0.66 |
Monday, June 30, 2014
Week 15 Attendance Update
| Team | 2014 Average Attendance | Capacity | Percent Full | 2013 Average Attendance | % Change from 2013 |
| Chicago Fire | 15,603 | 20,000 | 78.02% | 15,228 | +2.46 |
| Chivas USA | 7,277 | 18,800 | 38.71% | 8,366 | -13.02 |
| Colorado Rapids | 14,137 | 17,424 | 81.14% | 15,440 | -8.44 |
| Columbus Crew | 13,076 | 20,145 | 64.91% | 16,080 | -18.68 |
| DC United | 16,839 | 19,467 | 86.50% | 13,646 | +23.40 |
| FC Dallas | 16,459 | 20,500 | 80.29% | +7.06 | |
| Houston Dynamo | 19,437 | 22,039 | 88.19% | 19,923 | -2.44 |
| Los Angeles Galaxy | 20,372 | 27,000 | 75.45% | 22,152 | -8.03 |
| Montreal Impact | 19,394 | 20,521* | 94.51% | 20,603 | -5.87 |
| NE Revolution | 15,355 | 20,000 | 76.77% | 14,844 | +3.44 |
| New York Red Bulls | 18,182 | 25,189 | 72.18% | 19,461 | -6.57 |
| Philadelphia Union | 17,976 | 18,500 | 97.17% | 17,867 | +0.61 |
| Portland Timbers | 20,800 | 20,674 | 100.61% | 20,674 | +0.61 |
| Real Salt Lake | 20,137 | 20,213 | 99.63% | 19,218 | +4.78 |
| San Jose Earthquakes | 15,318 | 10,525* | 145.54% | 12,765 | +20.00 |
| Seattle Sounders | 40,091 | 38,500* | 104.13% | 44,038 | -8.96 |
| Sporting Kansas City | 19,715 | 18,467 | 106.76% | 19,709 | +0.03 |
| Toronto FC | 22,591 | 21,859 | 103.35% | 18,131 | +24.60 |
| Vancouver Whitecaps | 21,000 | 21,000 | 100.00% | 20,038 | +4.80 |
| Average | 18,496 | 21,096 | 87.68% | 18,608 | -0.60 |
Sunday, June 15, 2014
World Cup Break Attendance Update
| Team | 2014 Average Attendance | Capacity | Percent Full | 2013 Average Attendance | % Change from 2013 |
| Chicago Fire | 15,603 | 20,000 | 78.02% | 15,228 | +2.46 |
| Chivas USA | 7,504 | 18,800 | 39.91% | 8,366 | -10.31 |
| Colorado Rapids | 14,032 | 17,424 | 80.53% | 15,440 | -9.12 |
| Columbus Crew | 14,276 | 20,145 | 70.87% | 16,080 | -11.22 |
| DC United | 16,830 | 19,467 | 86.45% | 13,646 | +23.33 |
| FC Dallas | 16,459 | 20,500 | 80.29% | +7.06 | |
| Houston Dynamo | 19,437 | 22,039 | 88.19% | 19,923 | -2.44 |
| Los Angeles Galaxy | 20,372 | 27,000 | 75.45% | 22,152 | -8.03 |
| Montreal Impact | 19,771 | 20,521* | 96.35% | 20,603 | -4.04 |
| NE Revolution | 15,167 | 20,000 | 75.83% | 14,844 | +2.17 |
| New York Red Bulls | 17,850 | 25,189 | 70.86% | 19,461 | -8.28 |
| Philadelphia Union | 17,976 | 18,500 | 97.17% | 17,867 | +0.61 |
| Portland Timbers | 20,798 | 20,674 | 100.60% | 20,674 | +0.60 |
| Real Salt Lake | 20,137 | 20,213 | 99.63% | 19,218 | +4.78 |
| San Jose Earthquakes | 10,363 | 10,525* | 98.46% | 12,765 | -18.82 |
| Seattle Sounders | 40,091 | 38,500* | 104.13% | 44,038 | -8.96 |
| Sporting Kansas City | 19,715 | 18,467 | 106.76% | 19,709 | +0.03 |
| Toronto FC | 22,591 | 21,859 | 103.35% | 18,131 | +24.60 |
| Vancouver Whitecaps | 21,000 | 21,000 | 100.00% | 20,038 | +4.80 |
| Average | 18,496 | 21,096 | 87.67% | 18,608 | -0.60 |
Monday, June 2, 2014
Week 13 Attendance Update
| Team | 2014 Average Attendance | Capacity | Percent Full | 2013 Average Attendance | % Change from 2013 |
| Chicago Fire | 15,468 | 20,000 | 77.34% | 15,228 | +1.57 |
| Chivas USA | 7,504 | 18,800 | 39.91% | 8,366 | -10.31 |
| Colorado Rapids | 14,122 | 17,424 | 81.05% | 15,440 | -8.53 |
| Columbus Crew | 14,802 | 20,145 | 73.48% | 16,080 | -7.95 |
| DC United | 12,275 | 19,467 | 63.05% | 13,646 | -10.05 |
| FC Dallas | 16,490 | 20,500 | 80.44% | +7.27 | |
| Houston Dynamo | 19,586 | 22,039 | 88.87% | 19,923 | -1.69 |
| Los Angeles Galaxy | 20,527 | 27,000 | 76.02% | 22,152 | -7.34 |
| Montreal Impact | 20,711 | 20,521* | 100.92% | 20,603 | +0.52 |
| NE Revolution | 13,410 | 20,000 | 67.05% | 14,844 | -9.66 |
| New York Red Bulls | 17,850 | 25,189 | 70.86% | 19,461 | -8.28 |
| Philadelphia Union | 17,832 | 18,500 | 96.39% | 17,867 | -0.20 |
| Portland Timbers | 20,797 | 20,674 | 100.59% | 20,674 | +0.59 |
| Real Salt Lake | 20,080 | 20,213 | 99.34% | 19,218 | +4.49 |
| San Jose Earthquakes | 10,363 | 10,525* | 98.46% | 12,765 | -18.82 |
| Seattle Sounders | 40,091 | 38,500* | 104.13% | 44,038 | -8.96 |
| Sporting Kansas City | 19,715 | 18,467 | 106.76% | 19,709 | +0.03 |
| Toronto FC | 22,591 | 21,859 | 103.35% | 18,131 | +24.60 |
| Vancouver Whitecaps | 21,000 | 21,000 | 100.00% | 20,038 | +4.80 |
| Average | 18,262 | 21,096 | 86.57% | 18,608 | -1.86 |
Monday, May 26, 2014
Week 12 Attendance Update
| Team | 2014 Average Attendance | Capacity | Percent Full | 2013 Average Attendance | % Change from 2013 |
| Chicago Fire | 15,064 | 20,000 | 75.32% | 15,228 | -1.08 |
| Chivas USA | 8,719 | 18,800 | 46.38% | 8,366 | +4.21 |
| Colorado Rapids | 13,564 | 17,424 | 77.85% | 15,440 | -12.15 |
| Columbus Crew | 14,802 | 20,145 | 73.48% | 16,080 | -7.95 |
| DC United | 11,382 | 19,467 | 58.47% | 13,646 | -16.59 |
| FC Dallas | 16,606 | 20,500 | 81.00% | +8.02 | |
| Houston Dynamo | 19,586 | 22,039 | 88.87% | 19,923 | -1.69 |
| Los Angeles Galaxy | 20,527 | 27,000 | 76.02% | 22,152 | -7.34 |
| Montreal Impact | 21,239 | 20,521* | 103.50% | 20,603 | +3.09 |
| NE Revolution | 13,410 | 20,000 | 67.05% | 14,844 | -9.66 |
| New York Red Bulls | 17,850 | 25,189 | 70.86% | 19,461 | -8.28 |
| Philadelphia Union | 17,832 | 18,500 | 96.39% | 17,867 | -0.20 |
| Portland Timbers | 20,794 | 20,674 | 100.58% | 20,674 | +0.58 |
| Real Salt Lake | 20,080 | 20,213 | 99.34% | 19,218 | +4.49 |
| San Jose Earthquakes | 10,363 | 10,525* | 98.46% | 12,765 | -18.82 |
| Seattle Sounders | 40,212 | 38,500* | 104.45% | 44,038 | -8.69 |
| Sporting Kansas City | 19,785 | 18,467 | 107.14% | 19,709 | +0.39 |
| Toronto FC | 22,591 | 21,859 | 103.35% | 18,131 | +24.60 |
| Vancouver Whitecaps | 21,000 | 21,000 | 100.00% | 20,038 | +4.80 |
| Average | 18,288 | 21,096 | 86.69% | 18,608 | -1.72 |
Tuesday, May 13, 2014
Week 10 Attendance Update
| Team | 2014 Average Attendance | Capacity | Percent Full | 2013 Average Attendance | % Change from 2013 |
| Chicago Fire | 14,893 | 20,000 | 74.47% | 15,228 | -2.20 |
| Chivas USA | 8,719 | 18,800 | 46.38% | 8,366 | +4.21 |
| Colorado Rapids | 12,754 | 17,424 | 73.20% | 15,440 | -17.40 |
| Columbus Crew | 14,704 | 20,145 | 72.99% | 16,080 | -8.56 |
| DC United | 11,469 | 19,467 | 58.92% | 13,646 | -15.95 |
| FC Dallas | 16,867 | 20,500 | 82.28% | +9.72 | |
| Houston Dynamo | 19,145 | 22,039 | 86.87% | 19,923 | -3.91 |
| Los Angeles Galaxy | 23,241 | 27,000 | 86.08% | 22,152 | +4.91 |
| Montreal Impact | 21,239 | 20,521* | 103.50% | 20,603 | +3.09 |
| NE Revolution | 13,365 | 20,000 | 66.83% | 14,844 | -9.96 |
| New York Red Bulls | 17,517 | 25,189 | 69.54% | 19,461 | -9.99 |
| Philadelphia Union | 17,636 | 18,500 | 95.33% | 17,867 | -1.29 |
| Portland Timbers | 20,789 | 20,674 | 100.56% | 20,674 | +0.56 |
| Real Salt Lake | 19,876 | 20,213 | 98.33% | 19,218 | +3.42 |
| San Jose Earthquakes | 10,336 | 10,525* | 98.20% | 12,765 | -19.03 |
| Seattle Sounders | 38,623 | 38,500* | 100.32% | 44,038 | -12.30 |
| Sporting Kansas City | 19,902 | 18,467 | 107.77% | 19,709 | +0.98 |
| Toronto FC | 22,591 | 21,859 | 103.35% | 18,131 | +24.60 |
| Vancouver Whitecaps | 21,000 | 21,000 | 100.00% | 20,038 | +4.80 |
| Average | 18,109 | 21,096 | 85.84% | 18,608 | -2.68 |
Tuesday, May 6, 2014
Week 9 Attendance Update
| Team | 2014 Average Attendance | Capacity | Percent Full | 2013 Average Attendance | % Change from 2013 |
| Chicago Fire | 14,893 | 20,000 | 74.47% | 15,228 | -2.20 |
| Chivas USA | 8,719 | 18,800 | 46.38% | 8,366 | +4.21 |
| Colorado Rapids | 13,421 | 17,424 | 77.03% | 15,440 | -13.08 |
| Columbus Crew | 14,756 | 20,145 | 73.25% | 16,080 | -8.23 |
| DC United | 11,469 | 19,467 | 58.92% | 13,646 | -15.95 |
| FC Dallas | 16,867 | 20,500 | 82.28% | +9.72 | |
| Houston Dynamo | 20,831 | 22,039 | 94.52% | 19,923 | +4.56 |
| Los Angeles Galaxy | 23,241 | 27,000 | 86.08% | 22,152 | +4.91 |
| Montreal Impact | 22,417 | 20,521* | 109.24% | 20,603 | +8.80 |
| NE Revolution | 14,056 | 20,000 | 70.28% | 14,844 | -5.31 |
| New York Red Bulls | 15,953 | 25,189 | 63.33% | 19,461 | -18.03 |
| Philadelphia Union | 17,415 | 18,500 | 94.13% | 17,867 | -2.53 |
| Portland Timbers | 20,786 | 20,674 | 100.54% | 20,674 | +0.54 |
| Real Salt Lake | 19,876 | 20,213 | 98.33% | 19,218 | +3.42 |
| San Jose Earthquakes | 10,525 | 10,525* | 100.00% | 12,765 | -17.55 |
| Seattle Sounders | 38,650 | 38,500* | 100.39% | 44,038 | -12.24 |
| Sporting Kansas City | 19,902 | 18,467 | 107.77% | 19,709 | +0.98 |
| Toronto FC | 22,591 | 21,859 | 103.35% | 18,131 | +24.60 |
| Vancouver Whitecaps | 21,000 | 21,000 | 100.00% | 20,038 | +4.80 |
| Average | 18,257 | 21,096 | 86.54% | 18,608 | -1.89 |
Sorry for the Delay
Sorry for the delay, but I cannot find the attendance for these two games this weekend:
FC Dallas vs. NYRB
Toronto FC vs. NE Revolution
I have this problem every week (usually with the low attendance and less followed teams) and have about five different places I can look to find it. I have looked everywhere and haven't able to find it. The MLS is still a young league and it is still as hard as ever to find solid statistics at times.
If anyone could find these games for me that would be great! Also if you want a breakdown of any team feel free to comment. I have game by game data back to 2011 and historical data all the way back to the inception of the MLS. I like to compare trends year to year and see the weekly progressions of the teams as the summer or high profile games approach.
Thanks for all the views and I hope to keep posting more in depth statistics when I am able to (I travel quite a lot and will be going to Africa for two months so be patient with me).
I'm very excited to see how the statistics will change as the MLS expands to New York, Miami, Atlanta, and Orlando. They all seem to have the right idea with soccer specific stadiums in urban areas. This is an exciting time for the US world of soccer. Let's just hope the USMNT makes a good showing in Brazil!
Sunday, April 27, 2014
Week 8 Attendance Update
| Team | 2014 Average Attendance | Capacity | Percent Full | 2013 Average Attendance | % Change from 2013 |
| Chicago Fire | 14,890 | 20,000 | 74.45% | 15,228 | -2.22 |
| Chivas USA | 9,378 | 18,800 | 49.88% | 8,366 | +12.09 |
| Colorado Rapids | 13,215 | 17,424 | 75.84% | 15,440 | -14.41 |
| Columbus Crew | 14,756 | 20,145 | 73.25% | 16,080 | -8.23 |
| DC United | 11,469 | 19,467 | 58.92% | 13,646 | -15.95 |
| FC Dallas | 16,819 | 20,500 | 82.04% | +9.41 | |
| Houston Dynamo | 20,831 | 22,039 | 94.52% | 19,923 | +4.56 |
| Los Angeles Galaxy | 23,241 | 27,000 | 86.08% | 22,152 | +4.91 |
| Montreal Impact | 22,417 | 20,521* | 109.24% | 20,603 | +8.80 |
| NE Revolution | 14,056 | 20,000 | 70.28% | 14,844 | -5.31 |
| New York Red Bulls | 15,953 | 25,189 | 63.33% | 19,461 | -18.03 |
| Philadelphia Union | 17,415 | 18,500 | 94.13% | 17,867 | -2.53 |
| Portland Timbers | 20,779 | 20,674 | 100.51% | 20,674 | +0.51 |
| Real Salt Lake | 19,876 | 20,213 | 98.33% | 19,218 | +3.42 |
| San Jose Earthquakes | 10,525 | 10,525* | 100.00% | 12,765 | -17.55 |
| Seattle Sounders | 38,683 | 38,500* | 100.48% | 44,038 | -12.16 |
| Sporting Kansas City | 19,736 | 18,467 | 106.87% | 19,709 | +0.14 |
| Toronto FC | 22,591 | 21,859 | 103.35% | 18,131 | +24.60 |
| Vancouver Whitecaps | 21,000 | 21,000 | 100.00% | 20,038 | +4.80 |
| Average | 18,098 | 21,096 | 85.79% | 18,608 | -2.74 |
Sunday, April 20, 2014
Week 7 Attendance Update
| Team | 2014 Average Attendance | Capacity | Percent Full | 2013 Average Attendance | % Change from 2013 |
| Chicago Fire | 14,890 | 20,000 | 74.45% | 15,228 | -2.22 |
| Chivas USA | 9,378 | 18,800 | 49.88% | 8,366 | +12.09 |
| Colorado Rapids | 13,215 | 17,424 | 75.84% | 15,440 | -14.41 |
| Columbus Crew | 13,666 | 20,145 | 67.84% | 16,080 | -15.01 |
| DC United | 11,544 | 19,467 | 59.30% | 13,646 | -15.41 |
| FC Dallas | 16,525 | 20,500 | 80.61% | +7.50 | |
| Houston Dynamo | 20,922 | 22,039 | 94.93% | 19,923 | +5.02 |
| Los Angeles Galaxy | 23,241 | 27,000 | 86.08% | 22,152 | +4.91 |
| Montreal Impact | 23,530 | 20,521* | 114.66% | 20,603 | +14.21 |
| NE Revolution | 13,681 | 20,000 | 68.41% | 14,844 | -7.83 |
| New York Red Bulls | 16,844 | 25,189 | 66.87% | 19,461 | -13.45 |
| Philadelphia Union | 17,415 | 18,500 | 94.13% | 17,867 | -2.53 |
| Portland Timbers | 20,779 | 20,674 | 100.51% | 20,674 | +0.51 |
| Real Salt Lake | 19.948 | 20,213 | 98.69% | 19,218 | +3.80 |
| San Jose Earthquakes | 10,525 | 10,525* | 100.00% | 12,765 | -17.55 |
| Seattle Sounders | 38,717 | 38,500* | 100.56% | 44,038 | -12.08 |
| Sporting Kansas City | 19,736 | 18,467 | 106.87% | 19,709 | +0.14 |
| Toronto FC | 22,591 | 21,859 | 103.35% | 18,131 | +24.60 |
| Vancouver Whitecaps | 21,000 | 21,000 | 100.00% | 20,038 | +4.80 |
| Average | 18,029 | 21,096 | 85.46% | 18,608 | -3.11 |
Sunday, April 13, 2014
Week 6 Attendance Update
| Team | 2014 Average Attendance | Capacity | Percent Full | 2013 Average Attendance | % Change from 2013 |
| Chicago Fire | 14,464 | 20,000 | 72.32% | 15,228 | -5.02 |
| Chivas USA | 10,004 | 18,800 | 53.21% | 8,366 | +19.58 |
| Colorado Rapids | 13,669 | 17,424 | 78.45% | 15,440 | -11.47 |
| Columbus Crew | 14,781 | 20,145 | 73.37% | 16,080 | -8.08 |
| DC United | 11,544 | 19,467 | 59.30% | 13,646 | -15.41 |
| FC Dallas | 16,673 | 20,500 | 81.33% | +8.45 | |
| Houston Dynamo | 20,922 | 22,039 | 94.93% | 19,923 | +5.02 |
| Los Angeles Galaxy | 23,241 | 27,000 | 86.08% | 22,152 | +4.91 |
| Montreal Impact | 23,530 | 20,521* | 114.66% | 20,603 | +14.21 |
| NE Revolution | 13,681 | 20,000 | 68.41% | 14,844 | -7.73 |
| New York Red Bulls | 17,884 | 25,189 | 71.00% | 19,461 | -8.11 |
| Philadelphia Union | 17,452 | 18,500 | 94.34% | 17,867 | -2.32 |
| Portland Timbers | 20,779 | 20,674 | 100.51% | 20,674 | +0.51 |
| Real Salt Lake | 19.674 | 20,213 | 97.33% | 19,218 | +2.37 |
| San Jose Earthquakes | 10,525 | 10,525* | 100.00% | 12,765 | -17.55 |
| Seattle Sounders | 38,717 | 38,500* | 100.56% | 44,038 | -12.08 |
| Sporting Kansas City | 19,546 | 18,467 | 105.84% | 19,709 | -0.83 |
| Toronto FC | 22,591 | 21,859 | 103.35% | 18,131 | +24.60 |
| Vancouver Whitecaps | 21,000 | 21,000 | 100.00% | 20,038 | +4.80 |
| Average | 18,481 | 21,096 | 87.61% | 18,608 | -0.68 |
Tuesday, April 8, 2014
Week 5 Attendance Update
| Team | 2014 Average Attendance | Capacity | Percent Full | 2013 Average Attendance | % Change from 2013 |
| Chicago Fire | 14,464 | 20,000 | 72.32% | 15,228 | -5.02 |
| Chivas USA | 10,004 | 18,800 | 53.21% | 8,366 | +19.58 |
| Colorado Rapids | 13,669 | 17,424 | 78.45% | 15,440 | -11.47 |
| Columbus Crew | 14,781 | 20,145 | 73.37% | 16,080 | -8.08 |
| DC United | 11,270 | 19,467 | 57.89% | 13,646 | -17.41 |
| FC Dallas | 16,540 | 20,500 | 80.68% | +7.59 | |
| Houston Dynamo | 20,922 | 22,039 | 94.93% | 19,923 | +5.02 |
| Los Angeles Galaxy | 25,634 | 27,000 | 94.94% | 22,152 | +15.72 |
| Montreal Impact | 25,639 | 20,521* | 124.94% | 20,603 | +24.44 |
| NE Revolution | 13,103 | 20,000 | 65.52% | 14,844 | -11.73 |
| New York Red Bulls | 17,884 | 25,189 | 71.00% | 19,461 | -8.11 |
| Philadelphia Union | 17,171 | 18,500 | 92.82% | 17,867 | -3.90 |
| Portland Timbers | 20,767 | 20,674 | 100.45% | 20,674 | +0.45 |
| Real Salt Lake | 19.674 | 20,213 | 97.33% | 19,218 | +2.37 |
| San Jose Earthquakes | 10,525 | 10,525* | 100.00% | 12,765 | -17.55 |
| Seattle Sounders | 38,717 | 38,500* | 100.56% | 44,038 | -12.08 |
| Sporting Kansas City | 19,546 | 18,467 | 105.84% | 19,709 | -0.83 |
| Toronto FC | 22,591 | 21,859 | 103.35% | 18,131 | +24.60 |
| Vancouver Whitecaps | 21,000 | 21,000 | 100.00% | 20,038 | +4.80 |
| Average | 18,726 | 21,096 | 88.77% | 18,608 | +0.64 |
Sunday, March 30, 2014
Week 4 Attendance Update
| Team | 2014 Average Attendance | Capacity | Percent Full | 2013 Average Attendance | % Change from 2013 |
| Chicago Fire | 16,228 | 20,000 | 81.14% | 15,228 | +6.57 |
| Chivas USA | 7,502 | 18,800 | 39.90% | 8,366 | -10.33 |
| Colorado Rapids | 13,669 | 17,424 | 78.45% | 15,440 | -11.47 |
| Columbus Crew | 17,517 | 20,145 | 86.95% | 16,080 | +8.94 |
| DC United | 11,643 | 19,467 | 59.81% | 13,646 | -14.68 |
| FC Dallas | 16,540 | 20,500 | 80.68% | +7.59 | |
| Houston Dynamo | 20,283 | 22,039 | 92.03% | 19,923 | +1.80 |
| Los Angeles Galaxy | 25,634 | 27,000 | 94.94% | 22,152 | +15.72 |
| Montreal Impact | 27,207 | 20,521* | 132.58% | 20,603 | +32.05 |
| NE Revolution | 13,103 | 20,000 | 65.52% | 14,844 | -11.73 |
| New York Red Bulls | 17,884 | 25,189 | 71.00% | 19,461 | -8.11 |
| Philadelphia Union | 17,171 | 18,500 | 92.82% | 17,867 | -3.90 |
| Portland Timbers | 20,744 | 20,674 | 100.34% | 20,674 | +0.34 |
| Real Salt Lake | 19.674 | 20,213 | 97.33% | 19,218 | +2.37 |
| San Jose Earthquakes | 10,525 | 10,525* | 100.00% | 12.765 | -17.55 |
| Seattle Sounders | 38,717 | 38,500* | 100.56% | 44,038 | -12.08 |
| Sporting Kansas City | 19,400 | 18,467 | 105.05% | 19,709 | -1.57 |
| Toronto FC | 22,591 | 21,859 | 103.35% | 18,131 | +24.60 |
| Vancouver Whitecaps | 21,000 | 21,000 | 100.00% | 20,038 | +4.80 |
| Average | 19,030 | 21,096 | 90.21% | 18,608 | +2.27 |
Monday, March 24, 2014
Week 3 Attendance Update
| Team | 2014 Average Attendance | Capacity | Percent Full | 2013 Average Attendance | % Change from 2013 |
| Chicago Fire | 16,228 | 20,000 | 81.14% | 15,228 | +6.57 |
| Chivas USA | 7,502 | 18,800 | 39.90% | 8,366 | -10.33 |
| Colorado Rapids | 15,135 | 17,424 | 86.86% | 15,440 | -1.98 |
| Columbus Crew | 17,517 | 20,145 | 86.95% | 16,080 | +8.94 |
| DC United | 13,840 | 19,467 | 71.09% | 13,646 | +1.42 |
| FC Dallas | 16,788 | 20,500 | 81.89% | +9.20 | |
| Houston Dynamo | 20,283 | 22,039 | 92.03% | 19,923 | +1.80 |
| Los Angeles Galaxy | 25,634 | 27,000 | 94.94% | 22,152 | +15.72 |
| Montreal Impact | 27,207 | 20,521* | 132.58% | 20,603 | +32.05 |
| NE Revolution | 13,103 | 20,000 | 65.52% | 14,844 | -11.73 |
| New York Red Bulls | 20,542 | 25,189 | 81.55% | 19,461 | +5.55 |
| Philadelphia Union | 18,651 | 18,500 | 100.82% | 17,867 | +4.39 |
| Portland Timbers | 20,744 | 20,674 | 100.34% | 20,674 | +0.34 |
| Real Salt Lake | 20,466 | 20,213 | 101.25% | 19,218 | +6.49 |
| San Jose Earthquakes | 10,525 | 10,525* | 100.00% | 12.765 | -17.55 |
| Seattle Sounders | 38,841 | 38,500* | 100.88% | 44,038 | -11.80 |
| Sporting Kansas City | 19,400 | 18,467 | 105.05% | 19,709 | -1.57 |
| Toronto FC | 22,591 | 21,859 | 103.35% | 18,131 | +24.60 |
| Vancouver Whitecaps | 21,000 | 21,000 | 100.00% | 20,038 | +4.80 |
| Average | 19,582 | 21,096 | 92.82% | 18,608 | +5.23 |
Sunday, March 9, 2014
Week 1 Attendance Update
| Team | 2014 Average Attendance | Capacity | Percent Full | 2013 Average Attendance | % Change from 2013 |
| Chicago Fire | 20,000 | 15,228 | |||
| Chivas USA | 8,320 | 18,800 | 44.26% | 8,366 | -0.55 |
| Colorado Rapids | 17,424 | 15,440 | |||
| Columbus Crew | 20,145 | 16,080 | |||
| DC United | 13,840 | 19,467 | 71.09% | 13,646 | +1.42 |
| FC Dallas | 18,011 | 20,500 | 87.76% | +17.16 | |
| Houston Dynamo | 22,320 | 22,039 | 101.28% | 19,923 | +12.03 |
| Los Angeles Galaxy | 25,634 | 27,000 | 94.94% | 22,152 | +15.72 |
| Montreal Impact | 20,521* | 20,603 | |||
| NE Revolution | 20,000 | 14,844 | |||
| New York Red Bulls | 25,189 | 19,461 | |||
| Philadelphia Union | 18,500 | 17,867 | |||
| Portland Timbers | 20,674 | 20,674 | 100.00% | 20,674 | +0.00 |
| Real Salt Lake | 20,213 | 19,218 | |||
| San Jose Earthquakes | 10,525* | 12.765 | |||
| Seattle Sounders | 39,240 | 38,500* | 101.92% | 44,038 | -10.90 |
| Sporting Kansas City | 18,467 | 19,709 | |||
| Toronto FC | 21,859 | 18,131 | |||
| Vancouver Whitecaps | 21,000 | 21,000 | 100.00% | 20,038 | +4.80 |
| Average | 21,130 | 21,096 | 100.16% | 18,608 | +13.55 |
Subscribe to:
Posts (Atom)