| Team | 2013 Average Attendance | Capacity | Percent Full | 2012 Average Attendance | % Change from 2011 |
| Chicago Fire | 11,483 | 20,000 | 57.41% | 16,409 | -30.02 |
| Chivas USA | 6,961 | 18,800 | 37.03% | 13,056 | -46.68 |
| Colorado Rapids | 15,122 | 18,086 | 83.61% | 15,175 | -0.35 |
| Columbus Crew | 16,528 | 20,145 | 82.05% | 14,397 | +14.80 |
| DC United | 14,053 | 19,467 | 72.19% | 13,846 | +1.50 |
| FC Dallas | 14,960 | 20,500 | 72.97% | +5.36 | |
| Houston Dynamo | 18,224 | 22,039 | 82.69% | 21,015 | -13.28 |
| Los Angeles Galaxy | 19,726 | 27,000 | 73.06% | 23,136 | -14.74 |
| Montreal Impact | 32,078 | 20,521 | 156.32% | 22,772 | +40.86 |
| NE Revolution | 12,215 | 22,385 | 54.57% | 14,001 | -12.76 |
| New York Red Bulls | 22,022 | 25,189 | 87.43% | 18,281 | +20.46 |
| Philadelphia Union | 16,925 | 18,500 | 91.48% | 18,053 | -6.25 |
| Portland Timbers | 20,674 | 20,438 | 101.15% | 20,438 | +1.15 |
| Real Salt Lake | 20,370 | 20,213 | 100.78% | 19,087 | +6.72 |
| San Jose Earthquakes | 10,525 | 10,525 | 100.00% | 13,293 | -20.82 |
| Seattle Sounders | 39,574 | 38,500 | 102.79% | 43,144 | -8.27 |
| Sporting Kansas City | 19,868 | 18,467 | 107.59% | 19,404 | +2.39 |
| Toronto FC | 25,991 | 21,859 | 118.90% | 18,155 | +43.16 |
| Vancouver Whitecaps | 19,539 | 21,000 | 93.04% | 19,475 | +0.33 |
| Average | 18,434 | 21,244 | 86.77% | 18,807 | -1.98 |
Wednesday, March 27, 2013
Week 4 Attendance Update - Sorry for the wait


Friday, March 8, 2013
A Little Break
Just to let everyone know, I will not be posting for a few weeks, till probably the 23rd with updated attendance.

I will be heading to the land of Robbie Keane for a while to enjoy St. Patrick's Day in its finest form.

Because of this, there will be no posts for a while and the next attendance update will be of the previous few weeks. I wish the best to the MLS and hope for good crowds and attendance. I also hope that MLS clubs can get some much needed CCL wins to establish their presence in North America.
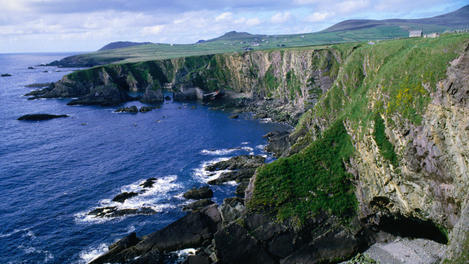
Till then, have a Happy St. Patrick's Day as I know I will roaming around Ireland for over a week.
I will be heading to the land of Robbie Keane for a while to enjoy St. Patrick's Day in its finest form.

Because of this, there will be no posts for a while and the next attendance update will be of the previous few weeks. I wish the best to the MLS and hope for good crowds and attendance. I also hope that MLS clubs can get some much needed CCL wins to establish their presence in North America.
Till then, have a Happy St. Patrick's Day as I know I will roaming around Ireland for over a week.
Monday, March 4, 2013
Week 1 Attendance - The 2013 Season Starts
| Team | 2013 Average Attendance | Capacity | Percent Full | 2012 Average Attendance | % Change from 2011 |
| Chicago Fire | 20,000 | % | 16,409 | ||
| Chivas USA | 7,121 | 18,800 | 37.88% | 13,056 | -45.46 |
| Colorado Rapids | 18,086 | % | 15,175 | ||
| Columbus Crew | 20,145 | % | 14,397 | ||
| DC United | 19,467 | % | 13,846 | ||
| FC Dallas | 18,075 | 20,500 | 88.17% | +27.30 | |
| Houston Dynamo | 20,019 | 22,039 | 90.83% | 21,015 | -4.74 |
| Los Angeles Galaxy | 20,124 | 27,000 | 74.53% | 23,136 | -13.02 |
| Montreal Impact | 20,521 | % | 22,772 | ||
| NE Revolution | 22,385 | % | 14,001 | ||
| New York Red Bulls | 25,189 | % | 18,281 | ||
| Philadelphia Union | 18,160 | 18,500 | 98.16% | 18,053 | +0.59 |
| Portland Timbers | 20,674 | 20,438 | 101.15% | 20,438 | +1.15 |
| Real Salt Lake | 20,213 | % | 19,087 | ||
| San Jose Earthquakes | 10,525 | 10,525 | 100.00% | 13,293 | -20.82 |
| Seattle Sounders | 38,998 | 38,500 | 101.29% | 43,144 | -9.61 |
| Sporting Kansas City | 18,467 | % | 19,404 | ||
| Toronto FC | 21,859 | % | 18,155 | ||
| Vancouver Whitecaps | 21,000 | 21,000 | 100.00% | 19,475 | +7.83 |
| Average | 19,411 | 21,244 | 91.37% | 18,807 | +3.21 |
Tuesday, December 18, 2012
Playoffs Attendance

I broke up the attendance by rounds and averaged them out along with the overall average.
The wild cards are hard to sell as they are so soon after the season ends.
All the semifinals and the final are sellouts for their respective home teams.

The quarterfinals found some problems with hurricane Sandy on the east coast that caused the schedule to be switched and a couple lower attendances resulted.
Overall, this is one of the highest attended playoffs ever with good growth and a lot of excitement that surrounded the games played.
| Round | Wild Card | Quarterfinals | Semifinals | Final | Overall |
| 1 | 10,923 | 34,941 | 22,101 | 30,510 | 22,356 |
| 2 | 14,703 | 17,556 | 27,000 | ||
| 3 | 20,689 | 44,575 | |||
| 4 | 27,000 | 20,015 | |||
| 5 | 20,894 | ||||
| 6 | 10,744 | ||||
| 7 | 14,035 | ||||
| 8 | 19,657 | ||||
| Average | 12,813 | 20,690 | 28,423 | 30,510 | 22,356 |
As a final side note, it will be interested how attendance will be affected with the departure of David Beckham and possibly other big names. The LA Galaxy sold out almost every road game as the opposing team would sell the Galaxy with their big names (Beckham, Keane, and Donavon) to the fans. It is because of this that many teams increased capacity or played at other facilities for these games. Can the MLS continue to sell on talent without the big names to draw the crowds?
Monday, December 17, 2012
Vancouver Whitecaps 2012 Attendance
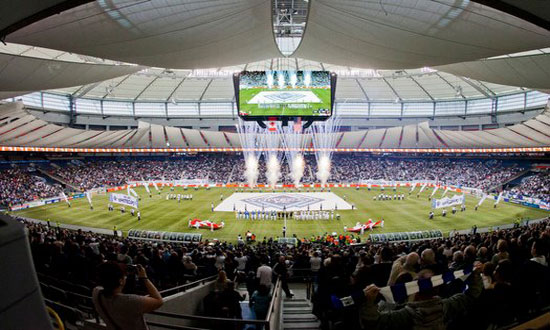
Last Years Attendance: 20,406
Percent Change: -4.56
| Game | Attendance | Capacity | Percent Full |
| Game 1 | 21,000 | 21,000 | 100.00% |
| Game 2 | 19,394 | 21,000 | 92.35% |
| Game 3 | 15,382 | 21,000 | 73.25% |
| Game 4 | 18,027 | 21,000 | 85.84% |
| Game 5 | 19,271 | 21,000 | 91.77% |
| Game 6 | 21,000 | 21,000 | 100.00% |
| Game 7 | 18,811 | 21,000 | 89.58% |
| Game 8 | 19,166 | 21,000 | 91.27% |
| Game 9 | 20,060 | 21,000 | 95.52% |
| Game 10 | 21,000 | 21,000 | 100.00% |
| Game 11 | 20,112 | 21,000 | 95.77% |
| Game 12 | 20,083 | 21,000 | 95.63% |
| Game 13 | 19,006 | 21,000 | 90.50% |
| Game 14 | 18,992 | 21,000 | 90.44% |
| Game 15 | 21,000 | 21,000 | 100.00% |
| Game 16 | 17,777 | 21,000 | 84.65% |
| Game 17 | 21,000 | 21,000 | 100.00% |
| Average | 19,475 | 21,000 | 92.74% |
Toronto FC 2012 Attendance

Last Years Attendance: 20,267
Percent Change: -10.42
| Game | Attendance | Capacity | Percent Full |
| Game 1 | 20,070 | 21,859 | 91.82% |
| Game 2 | 18,944 | 21,859 | 86.66% |
| Game 3 | 18,476 | 21,859 | 84.52% |
| Game 4 | 19,255 | 21,859 | 88.09% |
| Game 5 | 18,364 | 21,859 | 84.01% |
| Game 6 | 18,227 | 21,859 | 83.38% |
| Game 7 | 18,877 | 21,859 | 86.36% |
| Game 8 | 20,071 | 21,859 | 91.82% |
| Game 9 | 19,821 | 21,859 | 90.68% |
| Game 10 | 18,225 | 21,859 | 83.38% |
| Game 11 | 19,652 | 21,859 | 89.90% |
| Game 12 | 18,773 | 21,859 | 85.88% |
| Game 13 | 18,151 | 21,859 | 83.04% |
| Game 14 | 14,623 | 21,859 | 66.90% |
| Game 15 | 15,669 | 21,859 | 71.68% |
| Game 16 | 15,281 | 21,859 | 69.91% |
| Game 17 | 16,151 | 21,859 | 73.89% |
| Average | 18,155 | 21,859 | 83.05% |
Sporting Kansas City 2012 Attendance

Last Years Attendance: 17,810
Percent Change: +8.95
| Game | Attendance | Capacity | Percent Full |
| Game 1 | 19,777 | 18,467 | 107.09% |
| Game 2 | 15,161 | 18,467 | 82.10% |
| Game 3 | 20,323 | 18,467 | 110.05% |
| Game 4 | 19,422 | 18,467 | 105.17% |
| Game 5 | 20,404 | 18,467 | 110.49% |
| Game 6 | 19,974 | 18,467 | 108.16% |
| Game 7 | 20,488 | 18,467 | 110.94% |
| Game 8 | 19,274 | 18,467 | 104.37% |
| Game 9 | 19,307 | 18,467 | 104.55% |
| Game 10 | 19,080 | 18,467 | 103.32% |
| Game 11 | 18,938 | 18,467 | 102.55% |
| Game 12 | 20,439 | 18,467 | 110.68% |
| Game 13 | 18,491 | 18,467 | 100.13% |
| Game 14 | 18,481 | 18,467 | 100.08% |
| Game 15 | 19,877 | 18,467 | 107.64% |
| Game 16 | 21,010 | 18,467 | 113.77% |
| Game 17 | 19,428 | 18,467 | 105.20% |
| Average | 19,404 | 18,467 | 105.08% |
Seattle Sounders 2012 Attendance
Last Years Attendance: 38,495
Percent Change: +12.08
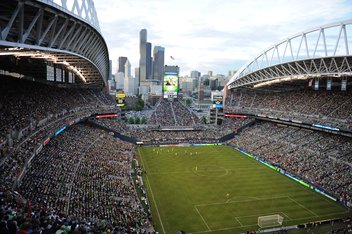
Seattle played 4 games to an expanded CenturyLink Field.
| Game | Attendance | Capacity | Percent Full |
| Game 1 | 38,709 | 38,500 | 100.54% |
| Game 2 | 38,304 | 38,500 | 99.49% |
| Game 3 | 38,301 | 38,500 | 99.48% |
| Game 4 | 38,360 | 38,500 | 99.64% |
| Game 5 | 39,002 | 38,500 | 101.30% |
| Game 6 | 38,399 | 38,500 | 99.74% |
| Game 7 | 39,312 | 38,500 | 102.11% |
| Game 8 | 38,311 | 38,500 | 99.51% |
| Game 9 | 46,932 | 67,000 | 70.05% |
| Game 10 | 39,060 | 38,500 | 101.45% |
| Game 11 | 60,908 | 67,000 | 90.91% |
| Game 12 | 55,718 | 67,000 | 83.16% |
| Game 13 | 38,934 | 38,500 | 101.13% |
| Game 14 | 38,948 | 38,500 | 101.16% |
| Game 15 | 66,452 | 67,000 | 99.18% |
| Game 16 | 38,356 | 38,500 | 99.63% |
| Game 17 | 38,755 | 38,500 | 100.66% |
| Average | 43,144 | 38,500 | 95.34% |
San Jose Earthquakes 2012 Attendance

Last Years Attendance: 11,858
Percent Change: +12.10
San Jose played Game 2 in AT&T Park home of the San Francisco Giants.
San Jose played Game 8 in Stanford Stadium home of the Stanford Cardinal.
| Game | Attendance | Capacity | Percent Full |
| Game 1 | 10,525 | 10,525 | 100.00% |
| Game 2 | 21,816 | 40,800 | 53.47% |
| Game 3 | 10,525 | 10,525 | 100.00% |
| Game 4 | 10,202 | 10,525 | 96.93% |
| Game 5 | 8,734 | 10,525 | 82.98% |
| Game 6 | 9,619 | 10,525 | 91.39% |
| Game 7 | 10,256 | 10,525 | 97.44% |
| Game 8 | 50,391 | 50,000 | 100.78% |
| Game 9 | 10,744 | 10,525 | 102.08% |
| Game 10 | 9,481 | 10,525 | 90.08% |
| Game 11 | 10,525 | 10,525 | 100.00% |
| Game 12 | 10,744 | 10,525 | 102.08% |
| Game 13 | 10,525 | 10,525 | 100.00% |
| Game 14 | 10,525 | 10,525 | 100.00% |
| Game 15 | 9,877 | 10,525 | 93.84% |
| Game 16 | 10,744 | 10,525 | 102.08% |
| Game 17 | 10,744 | 10,525 | 102.08% |
| Average | 13,293 | 10,525 | 90.82% |
Real Salt Lake 2012 Attendance
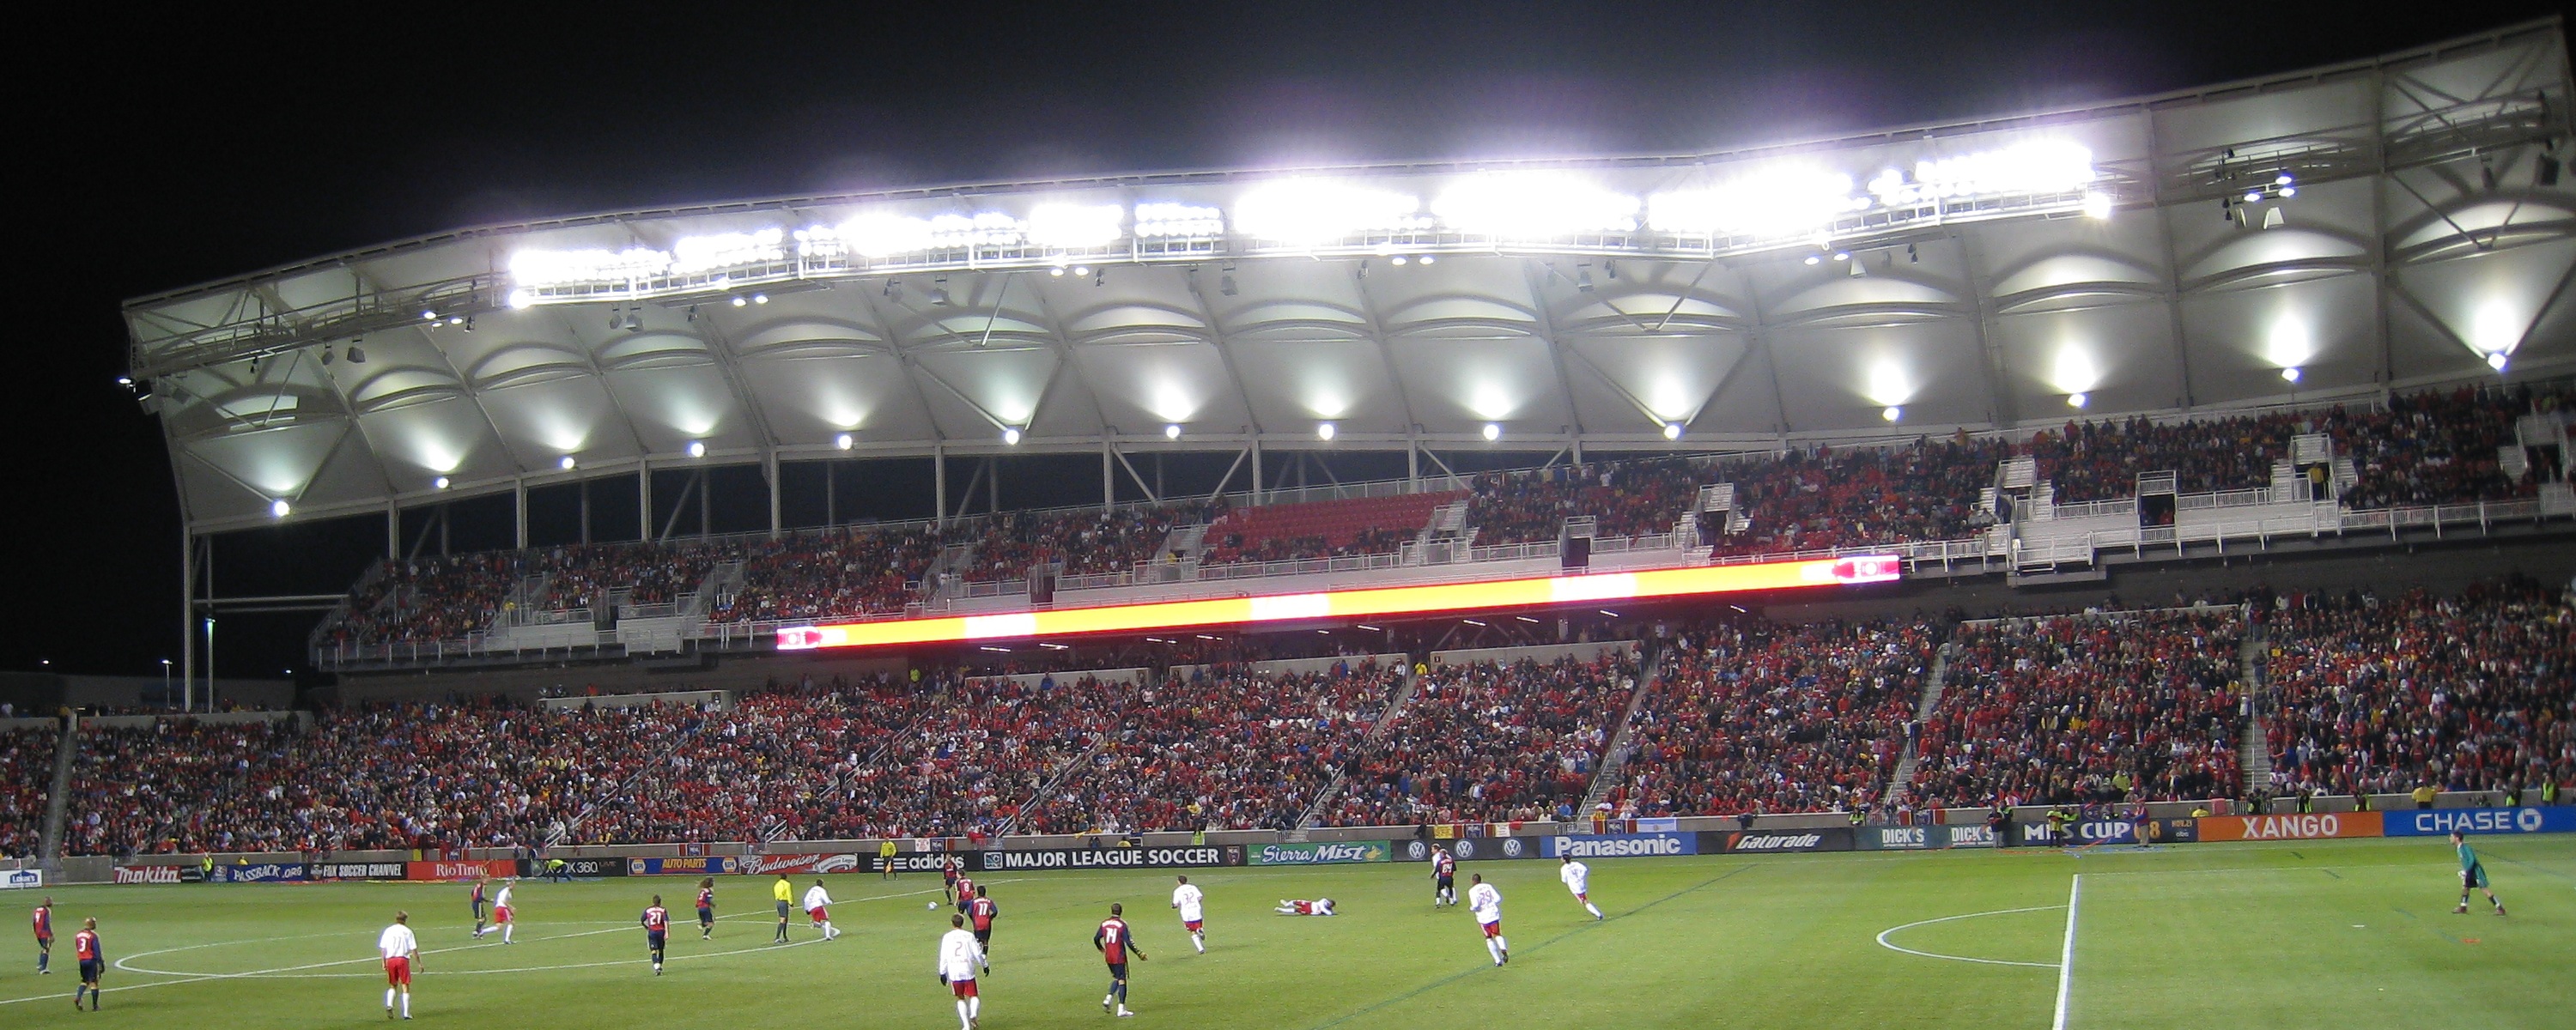
Last Years Attendance: 17,594
Percent Change: +8.49
| Game | Attendance | Capacity | Percent Full |
| Game 1 | 16,738 | 20,213 | 82.81% |
| Game 2 | 20,415 | 20,213 | 101.00% |
| Game 3 | 20,191 | 20,213 | 99.89% |
| Game 4 | 16,870 | 20,213 | 83.46% |
| Game 5 | 17,629 | 20,213 | 87.22% |
| Game 6 | 18,219 | 20,213 | 90.14% |
| Game 7 | 19,341 | 20,213 | 95.69% |
| Game 8 | 20,382 | 20,213 | 100.84% |
| Game 9 | 18,050 | 20,213 | 89.30% |
| Game 10 | 20,363 | 20,213 | 100.74% |
| Game 11 | 16,444 | 20,213 | 81.35% |
| Game 12 | 19,492 | 20,213 | 96.43% |
| Game 13 | 18,702 | 20,213 | 92.52% |
| Game 14 | 20,281 | 20,213 | 100.34% |
| Game 15 | 20,334 | 20,213 | 100.60% |
| Game 16 | 20,524 | 20,213 | 101.54% |
| Game 17 | 20,507 | 20,213 | 101.45% |
| Average | 19,087 | 20,213 | 94.43% |
Subscribe to:
Posts (Atom)