| Team | Attendance | Capacity | Percent Full | Percent Change Since 2010 |
| Chicago Fire | 14,026 | 20,000 | 70.13% | -11.30% |
| Chivas USA | 15,334 | 27,000 | 56.79% | 5.21% |
| Colorado Rapids | 14,258 | 19,680 | 72.45% | 6.98% |
| Columbus Crew | 10,483 | 20,455 | 51.25% | -28.40% |
| DC United | 15,557 | 45,596 | 34.12% | 7.06% |
| FC Dallas | 12,808 | 21,193 | 60.44% | 18.43% |
| Houston Dynamo | 17,198 | 32,350 | 53.16% | -0.64% |
| Los Angeles Galaxy | 22,206 | 27,000 | 82.24% | 3.59% |
| New England Revolution | 12,008 | 22,385 | 53.64% | -7.53% |
| New York Red Bulls | 18,204 | 25,189 | 72.27% | -1.29% |
| Philadelphia Union | 18,177 | 18,500 | 98.25% | -5.60% |
| Portland Timbers | 18,627 | 18,627 | 100.0% | --- |
| Real Salt Lake | 16,057 | 20,008 | 80.25% | -6.07% |
| San Jose Earthquakes | 9,909 | 10,300 | 96.21% | 2.59% |
| Seattle Sounders | 37,264 | 35,700 | 104.38% | 3.02% |
| Sporting Kansas City | 18,953 | 18,467 | 102.63% | 84.24% |
| Toronto FC | 19,882 | 23,000 | 86.44% | -2.79% |
| Vancouver Whitecaps | 19,618 | 20,000 | 98.09% | --- |
| Average | 17,400 | 23,636 | 73.61% | 4.35% |
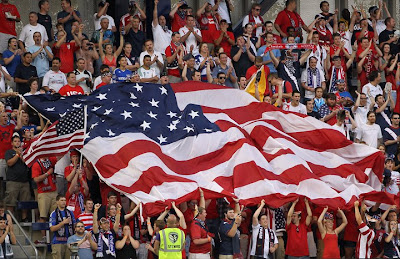
The attendance for the Gold Cup Final at the Rose Bowl was 93,420.
As most of you know, Mexico won 4-2.


