| Team | 2012 Average Attendance | Capacity | Percent Full | 2011 Average Attendance | % Change from 2011 |
| Chicago Fire | 15,721 | 20,000 | 78.61% | 14,274 | +10.14 |
| Chivas USA | 13,437 | 18,800 | 71.47% | 14,830 | -9.40 |
| Colorado Rapids | 15,119 | 18,086 | 83.60% | 14,838 | +1.90 |
| Columbus Crew | 14,537 | 20,145 | 72.16% | 12,185 | +19.30 |
| DC United | 13,735 | 19,467 | 70.56% | 15,211 | -9.70 |
| FC Dallas | 13,935 | 20,500 | 67.98% | +8.35 | |
| Houston Dynamo | 20,952 | 22,000 | 95.24% | 17,694 | +18.41 |
| Los Angeles Galaxy | 22,662 | 27,000 | 83.93% | 23,335 | -2.88 |
| Montreal Impact | 23,107 | 20,341 | 113.60% | --- | --- |
| NE Revolution | 12,916 | 20,000 | 64.58% | 13,222 | -2.31 |
| New York Red Bulls | 17,664 | 25,000 | 70.66% | 19,691 | -10.29 |
| Philadelphia Union | 18,420 | 18,500 | 99.56% | 18,258 | +0.88 |
| Portland Timbers | 20,438 | 20,438 | 100.00% | 18,827 | +8.56 |
| Real Salt Lake | 18,794 | 20,213 | 92.98% | 17,594 | +6.82 |
| San Jose Earthquakes | 14,161 | 10,525 | 134.54% | 11,858 | +19.42 |
| Seattle Sounders | 42,610 | 38,500 | 110.67% | 38,495 | +10.69 |
| Sporting Kansas City | 19,314 | 18,467 | 104.58% | 17,810 | +8.44 |
| Toronto FC | 18,993 | 21,140 | 99.84% | 20,267 | -6.29 |
| Vancouver Whitecaps | 19,409 | 21,000 | 92.42% | 20,406 | -4.89 |
| Average | 18,694 | 21,059 | 88.77% | 17,870 | +4.61 |
Sunday, August 26, 2012
August 26th Attendance Update


Monday, August 20, 2012
August 20 Attendance Update
| Team | 2012 Average Attendance | Capacity | Percent Full | 2011 Average Attendance | % Change from 2011 |
| Chicago Fire | 15,721 | 20,000 | 78.61% | 14,274 | +10.14 |
| Chivas USA | 13,559 | 18,800 | 72.12% | 14,830 | -8.57 |
| Colorado Rapids | 15,119 | 18,086 | 83.60% | 14,838 | +1.90 |
| Columbus Crew | 15,075 | 20,145 | 74.83% | 12,185 | +23.71 |
| DC United | 14,022 | 19,467 | 72.03% | 15,211 | -7.82 |
| FC Dallas | 13,935 | 20,500 | 67.98% | +8.35 | |
| Houston Dynamo | 21,088 | 22,000 | 95.86% | 17,694 | +19.18 |
| Los Angeles Galaxy | 22,729 | 27,000 | 84.18% | 23,335 | -2.60 |
| Montreal Impact | 23,328 | 20,341 | 114.69% | --- | --- |
| NE Revolution | 12,916 | 20,000 | 64.58% | 13,222 | -2.31 |
| New York Red Bulls | 17,664 | 25,000 | 70.66% | 19,691 | -10.29 |
| Philadelphia Union | 18,418 | 18,500 | 99.55% | 18,258 | +0.87 |
| Portland Timbers | 20,438 | 20,438 | 100.00% | 18,827 | +8.56 |
| Real Salt Lake | 18,794 | 20,213 | 92.98% | 17,594 | +6.82 |
| San Jose Earthquakes | 14,464 | 10,525 | 137.42% | 11,858 | +21.97 |
| Seattle Sounders | 42,610 | 38,500 | 110.67% | 38,495 | +10.69 |
| Sporting Kansas City | 19,382 | 18,467 | 104.96% | 17,810 | +8.83 |
| Toronto FC | 18,993 | 21,140 | 99.84% | 20,267 | -6.29 |
| Vancouver Whitecaps | 19,409 | 21,000 | 92.42% | 20,406 | -4.89 |
| Average | 18,825 | 21,059 | 89.39% | 17,870 | +5.35 |
Tuesday, August 7, 2012
August 7 Attendance Update
| Team | 2012 Average Attendance | Capacity | Percent Full | 2011 Average Attendance | % Change from 2011 |
| Chicago Fire | 15,560 | 20,000 | 77.80% | 14,274 | +9.01 |
| Chivas USA | 13,191 | 18,800 | 70.16% | 14,830 | -11.05 |
| Colorado Rapids | 15,073 | 18,086 | 83.34% | 14,838 | +1.58 |
| Columbus Crew | 14,858 | 20,145 | 73.76% | 12,185 | +21.94 |
| DC United | 14,178 | 19,467 | 72.83% | 15,211 | -6.79 |
| FC Dallas | 14,221 | 20,500 | 69.37% | +10.57 | |
| Houston Dynamo | 21,136 | 22,000 | 96.07% | 17,694 | +19.45 |
| Los Angeles Galaxy | 22,729 | 27,000 | 84.18% | 23,335 | -2.60 |
| Montreal Impact | 23,628 | 20,341 | 116.16% | --- | --- |
| NE Revolution | 12,922 | 20,000 | 64.61% | 13,222 | -2.27 |
| New York Red Bulls | 17,720 | 25,000 | 70.88% | 19,691 | -10.01 |
| Philadelphia Union | 18,418 | 18,500 | 99.56% | 18,258 | +0.88 |
| Portland Timbers | 20,438 | 20,438 | 100.00% | 18,827 | +8.56 |
| Real Salt Lake | 18,680 | 20,213 | 92.41% | 17,594 | +6.17 |
| San Jose Earthquakes | 14,802 | 10,525 | 140.63% | 11,858 | +24.82 |
| Seattle Sounders | 41,418 | 38,500 | 107.58% | 38,495 | +7.59 |
| Sporting Kansas City | 19,286 | 18,467 | 104.44% | 17,810 | +8.29 |
| Toronto FC | 19,089 | 21,140 | 90.30% | 20,267 | -5.81 |
| Vancouver Whitecaps | 19,384 | 21,000 | 92.30% | 20,406 | -5.01 |
| Average | 18,811 | 21,059 | 89.32% | 17,870 | +5.27 |
Sunday, July 15, 2012
Week 17 Attendance Update
| Team | 2012 Average Attendance | Capacity | Percent Full | 2011 Average Attendance | % Change from 2011 |
| Chicago Fire | 15,540 | 20,000 | 77.70% | 14,274 | +8.87 |
| Chivas USA | 13,127 | 18,800 | 69.83% | 14,830 | -11.48 |
| Colorado Rapids | 15,184 | 18,086 | 83.95% | 14,838 | +2.33 |
| Columbus Crew | 14,572 | 20,145 | 72.34% | 12,185 | +19.59 |
| DC United | 14,132 | 19,467 | 72.59% | 15,211 | -7.10 |
| FC Dallas | 13,722 | 20,500 | 66.93% | +6.69 | |
| Houston Dynamo | 21,287 | 22,000 | 96.76% | 17,694 | +20.31 |
| Los Angeles Galaxy | 22,483 | 27,000 | 83.27% | 23,335 | -3.65 |
| Montreal Impact | 25,357 | 20,341 | 124.66% | --- | --- |
| NE Revolution | 12,455 | 20,000 | 62.27% | 13,222 | -5.80 |
| New York Red Bulls | 17,443 | 25,000 | 69.77% | 19,691 | -11.42 |
| Philadelphia Union | 18,398 | 18,500 | 99.45% | 18,258 | +0.77 |
| Portland Timbers | 20,438 | 20,438 | 100.00% | 18,827 | +8.56 |
| Real Salt Lake | 18,604 | 20,213 | 92.04% | 17,594 | +5.74 |
| San Jose Earthquakes | 15,868 | 10,525 | 150.76% | 11,858 | +33.82 |
| Seattle Sounders | 39,469 | 38,500 | 102.52% | 38,495 | +2.53 |
| Sporting Kansas City | 19,348 | 18,467 | 104.77% | 17,810 | +8.63 |
| Toronto FC | 19,123 | 21,140 | 90.46% | 20,267 | -5.65 |
| Vancouver Whitecaps | 19,123 | 21,000 | 91.06% | 20,406 | -6.29 |
| Average | 18,733 | 21,059 | 88.95% | 17,870 | +4.83 |
Monday, July 9, 2012
Week 16 Attendance Update

The MLS had a great pre-Fourth of July weekend and Fourth of July turnout. Almost all teams sold out games during this time every team had a higher than normal turnout. What says America more than soccer now a days?

San Jose pulled off another great turnout against the Galaxy in the California Classico just like they did last year. They had over 50,000 come out to see Wondolowski help the Quakes come back and win a 4-3 thriller. This bodes well for San Jose as they get a new stadium in the near future with a capacity near 18,000.
Otherwise the MLS has had a pretty good turnout since it's short break during the Euro Cup. With no announcement yet, I am assuming the MLS will stay at 19 teams for next year. So the best we can hope for is growth within the teams. Better talent seems to be coming in free agent signings and more people are becoming interested in Major League Soccer. As attendances increase and the level of play increases, it seems the MLS and Don Garber are on the right track.
| Team | 2012 Average Attendance | Capacity | Percent Full | 2011 Average Attendance | % Change from 2011 |
| Chicago Fire | 15,398 | 20,000 | 76.99% | 14,274 | +7.88 |
| Chivas USA | 13,127 | 18,800 | 69.83% | 14,830 | -11.48 |
| Colorado Rapids | 15,395 | 18,086 | 85.12% | 14,838 | +3.75 |
| Columbus Crew | 14,141 | 20,145 | 70.20% | 12,185 | +16.05 |
| DC United | 14,132 | 19,467 | 72.59% | 15,211 | -7.10 |
| FC Dallas | 13,722 | 20,500 | 66.93% | +6.69 | |
| Houston Dynamo | 21,632 | 22,000 | 98.33% | 17,694 | +22.26 |
| Los Angeles Galaxy | 22,483 | 27,000 | 83.27% | 23,335 | -3.65 |
| Montreal Impact | 25,357 | 20,341 | 124.66% | --- | --- |
| NE Revolution | 12,485 | 20,000 | 52.43% | 13,222 | -5.57 |
| New York Red Bulls | 17,161 | 25,000 | 68.64% | 19,691 | -12.85 |
| Philadelphia Union | 18,380 | 18,500 | 99.35% | 18,258 | +0.67 |
| Portland Timbers | 20,438 | 20,438 | 100.00% | 18,827 | +8.56 |
| Real Salt Lake | 18,604 | 20,213 | 92.04% | 17,594 | +5.74 |
| San Jose Earthquakes | 16,509 | 10,525 | 156.85% | 11,858 | +39.22 |
| Seattle Sounders | 39,469 | 38,500 | 102.52% | 38,495 | +2.53 |
| Sporting Kansas City | 19,348 | 18,467 | 104.77% | 17,810 | +8.63 |
| Toronto FC | 19,036 | 21,140 | 90.04% | 20,267 | -6.08 |
| Vancouver Whitecaps | 19,123 | 21,000 | 91.06% | 20,406 | -6.29 |
| Average | 18,847 | 21,059 | 89.50% | 17,870 | +5.47 |
Saturday, June 30, 2012
Vacation Update - Montreal falls from attendance graces
This is the first time I have posted from my iPhone so be wary. I am currently camping in Colorado until July 9th. I will be away from a computer and my database, so there will be no updates till then. Till then I hope everyone keeps watching some great MLS games. I will continue to ponder the Impact's fall from attendance grace. They hosted crowds of 58,000+ and 60,000+ and at one point lead the league in attendance. Since moving to Stade Saputo, they have recorded some terrible attendance. Their first game in the stadium wasn't a sellout and a mere 17,000 people showed up to see them beat the Sounders. Since then they have seen crowds of 12,000 for a 4-2 drubbing of Houston and 14,000 in a 3-0 loss to Toronto. I don't get it. This team is winning. They just played two of the most interesting teams in the MLS with some great talent to mediocre crowds. Oh and isn't there a source of rivalry between Toronto and Montreal? This fan base has fallen from the graces. What more can you ask for then a fun and exciting team that is winning as an expansion team. Was I asking too much to expect Montreal to continue the Canadian ways of hosting consistent crowds of 20,000+? Comments please.
Sunday, June 24, 2012
Week 15 Attendance Update

The MLS had a decent week in terms of attendance. It was capped off by a couple fun nationally televised games with crazy crowds. Portland earned a 2-1 victory in front of a boisterous Timbers Army while the New York Red Bulls sold out their first game of the year beating the league leading DC United 3-2. These were both fun games to watch and after seeing them, who wouldn't want to head out to catch the action themselves in person.
| Team | 2012 Average Attendance | Capacity | Percent Full | 2011 Average Attendance | % Change from 2011 |
| Chicago Fire | 14,756 | 20,000 | 73.78% | 14,274 | +3.38 |
| Chivas USA | 13,291 | 18,800 | 70.69% | 14,830 | -10.38 |
| Colorado Rapids | 14,892 | 18,086 | 82.34% | 14,838 | +0.36 |
| Columbus Crew | 13,219 | 20,145 | 65.62% | 12,185 | +8.49 |
| DC United | 13,668 | 19,467 | 70.21% | 15,211 | -10.14 |
| FC Dallas | 13,255 | 20,500 | 64.66% | +3.07 | |
| Houston Dynamo | 21,916 | 22,000 | 99.62% | 17,694 | +23.86 |
| Los Angeles Galaxy | 21,982 | 27,000 | 81.41% | 23,335 | -5.80 |
| Montreal Impact | 30,280 | 20,341 | 163.54% | --- | --- |
| NE Revolution | 11,819 | 20,000 | 59.09% | 13,222 | -10.61 |
| New York Red Bulls | 17,161 | 25,000 | 68.64% | 19,691 | -12.85 |
| Philadelphia Union | 18,378 | 18,500 | 99.34% | 18,258 | +0.66 |
| Portland Timbers | 20,438 | 20,438 | 100.00% | 18,827 | +8.56 |
| Real Salt Lake | 18,648 | 20,213 | 92.26% | 17,594 | +5.99 |
| San Jose Earthquakes | 11,668 | 10,525 | 110.86% | 11,858 | -1.60 |
| Seattle Sounders | 39,514 | 38,500 | 102.63% | 38,495 | +2.65 |
| Sporting Kansas City | 19,364 | 18,467 | 104.86% | 17,810 | +8.73 |
| Toronto FC | 18,888 | 21,140 | 89.35% | 20,267 | -6.81 |
| Vancouver Whitecaps | 19,123 | 21,000 | 91.06% | 20,406 | -6.29 |
| Average | 18,650 | 21,059 | 88.56% | 17,870 | +4.37 |
Monday, June 18, 2012
Week 14 - The MLS is back!
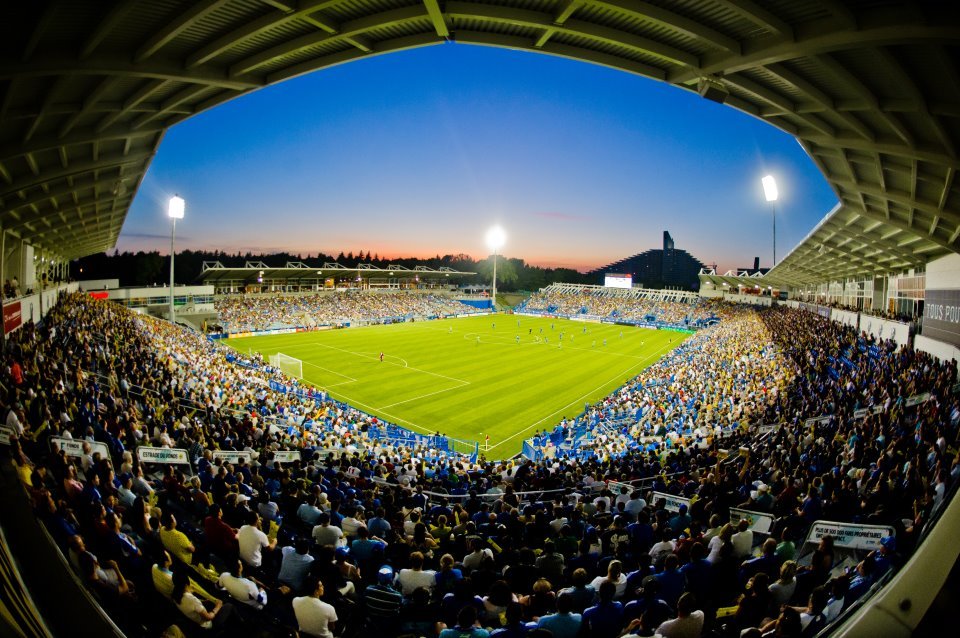
Sorry I was away from my computer as I was on a vacation the last 4 days. After the Euro Cup group stage break, the MLS started back up this weekend. Watching the Euro Cup has been quite a lot of fun as nothing can rival the intensity of each nation and the competition. Meanwhile, Montreal opened their newly redone Saputo Stadium to a decent crowd (17,112 and 84.12% full) as they beat up on the Sounders.
| Team | 2012 Average Attendance | Capacity | Percent Full | 2011 Average Attendance | % Change from 2011 |
| Chicago Fire | 14,415 | 20,000 | 72.08% | 14,274 | +0.99 |
| Chivas USA | 13,655 | 18,800 | 72.63% | 14,830 | -7.92 |
| Colorado Rapids | 15,194 | 18,086 | 84.01% | 14,838 | +2.40 |
| Columbus Crew | 13,219 | 20,145 | 65.62% | 12,185 | +8.49 |
| DC United | 13,668 | 19,467 | 70.21% | 15,211 | -10.14 |
| FC Dallas | 13,181 | 20,500 | 64.30% | +2.49 | |
| Houston Dynamo | 22,039 | 22,000 | 100.18% | 17,694 | +24.56 |
| Los Angeles Galaxy | 22,038 | 27,000 | 81.62% | 23,335 | -5.56 |
| Montreal Impact | 33,267 | 20,341 | 163.54% | --- | --- |
| NE Revolution | 11,819 | 20,000 | 59.09% | 13,222 | -10.61 |
| New York Red Bulls | 15,823 | 25,000 | 63.29% | 19,691 | -19.64 |
| Philadelphia Union | 18,407 | 18,500 | 99.49% | 18,258 | +0.81 |
| Portland Timbers | 20,438 | 20,438 | 100.00% | 18,827 | +8.56 |
| Real Salt Lake | 18,486 | 20,213 | 91.46% | 17,594 | +5.07 |
| San Jose Earthquakes | 11,668 | 10,525 | 110.86% | 11,858 | -1.60 |
| Seattle Sounders | 38,587 | 38,500 | 100.23% | 38,495 | +0.24 |
| Sporting Kansas City | 19,364 | 18,467 | 104.86% | 17,810 | +8.73 |
| Toronto FC | 18,889 | 21,140 | 89.35% | 20,267 | -6.80 |
| Vancouver Whitecaps | 19,006 | 21,000 | 90.51% | 20,406 | -6.86 |
| Average | 18,512 | 21,059 | 87.90% | 17,870 | +3.59 |
Sunday, June 3, 2012
Week 13 - USOC and USMNT Play
There has only been one MLS match played this week. The US soccer world has been filled with USMNT friendlies to prepare for World Cup qualifying along with US Open Cup games.

The US Open Cup had a crazy start this past week. It is nice to see the Cup expand to include a large field, and there was no shortage of drama as the 16 United States MLS teams joined the action. After all was said and done, the West's best Real Salt Lake were bounced by the Minnesota Stars along with many other MLS teams. Only half of the MLS teams won as the fourth round sees only 8 MLS teams joined by 3 NASL teams, 3 USLPro teams, a PDL team, and a USASA team. History has already been made, and it is not over. These teams from the 2nd to 4th division and even an adult team are playing their hearts out as the MLS puts on reserves. I know some MLS teams do not care about the US Open Cup, but there is something to be said about putting a team on the field, even if they are reserves to get a win for your team. The Sounders have shown what can be done with effort in the USOC, and isn't the bid for the CONCACAF Champions League enough of a reason to try? Tuesday will host the fourth round of the Cup.

Meanwhile the US has shown a stellar offensive team against Scotland, a lackluster team against Brazil, and a just plain boring team that got out played tonight against Canada. It will be interesting to see how the US will be able to find their shape and lineup as Klinsmann has been switching between a 4-4-2 and a 4-3-3. The men will start their bid for the 2014 World Cup later this week in Florida playing a should be cake team in Antigua and Barbuda. The will then face a tougher challenge against Guatemala to finish this cycle of national games. MLS will then start back up as the world of soccer will be caught up in the Euro Cup.

As to MLS attendance, it has started to level off at around 18,500 as the league looks to set even more attendance records this year. It will be interesting to see how attendance rises in the summer and how it will decline in the fall as football season kicks in. The MLS has league play all the way till October with the playoffs ending with the MLS Cup on December 1. We aren't even half way through the season, but the MLS is still expanding and showing growth in attendance, something that will hopefully catch the view of the world.
The US Open Cup had a crazy start this past week. It is nice to see the Cup expand to include a large field, and there was no shortage of drama as the 16 United States MLS teams joined the action. After all was said and done, the West's best Real Salt Lake were bounced by the Minnesota Stars along with many other MLS teams. Only half of the MLS teams won as the fourth round sees only 8 MLS teams joined by 3 NASL teams, 3 USLPro teams, a PDL team, and a USASA team. History has already been made, and it is not over. These teams from the 2nd to 4th division and even an adult team are playing their hearts out as the MLS puts on reserves. I know some MLS teams do not care about the US Open Cup, but there is something to be said about putting a team on the field, even if they are reserves to get a win for your team. The Sounders have shown what can be done with effort in the USOC, and isn't the bid for the CONCACAF Champions League enough of a reason to try? Tuesday will host the fourth round of the Cup.
Meanwhile the US has shown a stellar offensive team against Scotland, a lackluster team against Brazil, and a just plain boring team that got out played tonight against Canada. It will be interesting to see how the US will be able to find their shape and lineup as Klinsmann has been switching between a 4-4-2 and a 4-3-3. The men will start their bid for the 2014 World Cup later this week in Florida playing a should be cake team in Antigua and Barbuda. The will then face a tougher challenge against Guatemala to finish this cycle of national games. MLS will then start back up as the world of soccer will be caught up in the Euro Cup.
As to MLS attendance, it has started to level off at around 18,500 as the league looks to set even more attendance records this year. It will be interesting to see how attendance rises in the summer and how it will decline in the fall as football season kicks in. The MLS has league play all the way till October with the playoffs ending with the MLS Cup on December 1. We aren't even half way through the season, but the MLS is still expanding and showing growth in attendance, something that will hopefully catch the view of the world.
Tuesday, May 29, 2012
Week 12 Attendance Update
 |
| The Greatest Spectacle in Racing |
Sorry for the delay. This Memorial Day weekend I took a 5 day trip to the Indy 500 and a few other midwest cities. I saw my Minnesota Twins lose to the Chicago White Sox at US Cellular too. I enjoyed some sporting events, and the epitome of white trash. I even got to see some of the USMNT game vs Scotland in a restaurant. They clicked and this was a good start for this 5 game stretch for them. Maybe when Landon returns to LA they can change their ways, but as for now, they are at the bottom of the Western conference.
I did not see much of the MLS games, but they looked to be exciting and full of goals. This Memorial Day Weekend was also good for attendance as many teams had large or sell out crowds.

| Team | 2012 Average Attendance | Capacity | Percent Full | 2011 Average Attendance | % Change from 2011 |
| Chicago Fire | 13,730 | 20,000 | 68.65% | 14,274 | -3.81 |
| Chivas USA | 13,632 | 18,800 | 72.51% | 14,830 | -8.08 |
| Colorado Rapids | 15,194 | 18,086 | 84.01% | 14,838 | +2.40 |
| Columbus Crew | 13,219 | 20,145 | 65.62% | 12,185 | +8.49 |
| DC United | 13,668 | 19,467 | 70.21% | 15,211 | -10.14 |
| FC Dallas | 13,181 | 20,500 | 64.30% | +2.49 | |
| Houston Dynamo | 22,039 | 22,000 | 100.18% | 17,694 | +24.56 |
| Los Angeles Galaxy | 22,242 | 27,000 | 82.38% | 23,335 | -4.68 |
| Montreal Impact | 36,498 | 20,341 | 179.43% | --- | --- |
| NE Revolution | 11,598 | 20,000 | 57.99% | 13,222 | -12.28 |
| New York Red Bulls | 15,823 | 25,000 | 63.29% | 19,691 | -19.64 |
| Philadelphia Union | 18,313 | 18,500 | 98.99% | 18,258 | +0.30 |
| Portland Timbers | 20,438 | 20,438 | 100.00% | 18,827 | +8.56 |
| Real Salt Lake | 18,486 | 20,213 | 91.46% | 17,594 | +5.07 |
| San Jose Earthquakes | 11,668 | 10,525 | 110.86% | 11,858 | -1.60 |
| Seattle Sounders | 38,587 | 38,500 | 100.23% | 38,495 | +0.24 |
| Sporting Kansas City | 19,177 | 18,467 | 103.84% | 17,810 | +7.67 |
| Toronto FC | 18,889 | 21,140 | 89.35% | 20,267 | -6.80 |
| Vancouver Whitecaps | 19,012 | 21,000 | 90.53% | 20,406 | -6.83 |
| Average | 18,590 | 21,059 | 88.28% | 17,870 | +4.03 |
Subscribe to:
Posts (Atom)