To put this in perspective:
Seattle had as many people at one game as Chivas USA has had in 9 games combined.
| Team | 2013 Average Attendance | Capacity | Percent Full | 2012 Average Attendance | % Change from 2011 |
| Chicago Fire | 14,300 | 20,000 | 71.50% | 16,409 | -12.85 |
| Chivas USA | 8,503 | 18,800 | 45.23% | 13,056 | -34.87 |
| Colorado Rapids | 15,225 | 18,086 | 84.18% | 15,175 | +0.33 |
| Columbus Crew | 15,249 | 20,145 | 75.70% | 14,397 | +5.92 |
| DC United | 13,604 | 19,467 | 69.88% | 13,846 | -1.75 |
| FC Dallas | 15.940 | 20,500 | 77.75% | +12.26 | |
| Houston Dynamo | 20,114 | 22,039 | 91.26% | 21,015 | -4.29 |
| Los Angeles Galaxy | 21,989 | 27,000 | 81.44% | 23,136 | -4.96 |
| Montreal Impact | 20,933 | 20,521 | 102.01% | 22,772 | -8.07 |
| NE Revolution | 13,550 | 22,385 | 60.53% | 14,001 | -3.22 |
| New York Red Bulls | 18,901 | 25,189 | 75.04% | 18,281 | +3.39 |
| Philadelphia Union | 17,629 | 18,500 | 95.29% | 18,053 | -2.35 |
| Portland Timbers | 20,674 | 20,674 | 100.00% | 20,438 | +1.15 |
| Real Salt Lake | 18,847 | 20,213 | 93.24% | 19,087 | -1.26 |
| San Jose Earthquakes | 13,492 | 10,525 | 128.19% | 13,293 | +1.50 |
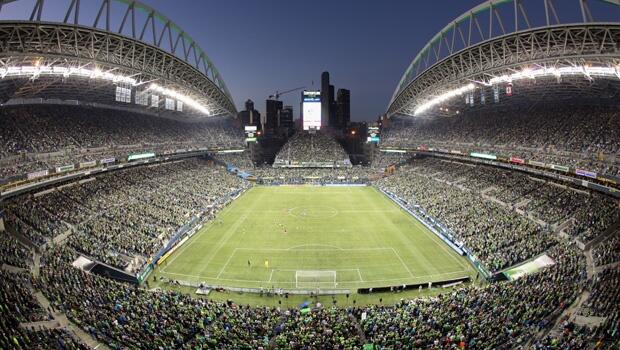
| Seattle Sounders | 42,963 | 38,500 | 111.59% | 43,144 | -0.42 |
| Sporting Kansas City | 19,853 | 18,467 | 107.51% | 19,404 | +2.32 |
| Toronto FC | 19,390 | 21,859 | 88.70% | 18,155 | +6.80 |
| Vancouver Whitecaps | 19,968 | 21,000 | 95.09% | 19,475 | +2.53 |
| Average | 18,224 | 21,256 | 85.74% | 18,807 | -3.10 |
