| Team | Attendance | Capacity | Percent Full | Last Year's Average Attendance |
| Chicago Fire | 14,018 | 20,000 | 70.09% | 15,814 |
| Chivas USA | 14,402 | 27,000 | 53.34% | 14,575 |
| Colorado Rapids | 14,584 | 18,086 | 80.64% | 13,328 |
| Columbus Crew | 11,278 | 20,455 | 55.13% | 14,641 |
| DC United | 14,800 | 23,865 | 62.01% | 14,531 |
| FC Dallas | 12,957 | 21,193 | 61.14% | 10,815 |
| Houston Dynamo | 16,793 | 25,462 | 65.95% | 17,309 |
| Los Angeles Galaxy | 23,051 | 27,000 | 85.37% | 21,436 |
| New England Revolution | 12,527 | 22,385 | 55.96% | 12,986 |
| New York Red Bulls | 18,796 | 25,189 | 74.62% | 18,441 |
| Philadelphia Union | 18,308 | 18,500 | 98.96% | 19,254 |
| Portland Timbers | 18,627 | 18,627 | 100.0% | --- |
| Real Salt Lake | 16,873 | 20,008 | 84.33% | 17,095 |
| San Jose Earthquakes | 12,128 | 10,300 | 117.75% | 9,659 |
| Seattle Sounders | 37,061 | 35,700 | 103.81% | 36,173 |
| Sporting Kansas City | 17,578 | 18,467 | 95.19% | 10,287 |
| Toronto FC | 20,178 | 21,800 | 92.56% | 20,453 |
| Vancouver Whitecaps | 20,160 | 20,500 | 98.34% | --- |
| Average | 17,420 | 21,919 | 79.48% | 16,675 |
Sunday, August 28, 2011
Week 24 MLS Attendance Update


Monday, August 1, 2011
Seattle Sounders Attendance Update
Game | Attendance | Percent Full | % Change from 2010 Attendance |
Game 1 | 36,433 | 102.1% | 0.72% |
Game 2 | 36,204 | 101.4% | 0.09% |
Game 3 | 36,223 | 101.5% | 0.14% |
Game 4 | 36,287 | 101.6% | 0.32% |
Game 5 | 36,593 | 102.5% | 1.16% |
Game 6 | 36,098 | 101.1% | -0.21% |
Game 7 | 36,026 | 100.9% | -0.40% |
Game 8 | 36,502 | 102.2% | 0.91% |
Game 9 | 46,065* | 129.0% | 27.35% |
Game 10 | 36,212 | 101.4% | 0.11% |
Game 11 | 36,424 | 102.0% | 0.69% |
Game 12 | |||
Game 13 | |||
Game 14 | |||
Game 15 | |||
Game 16 | |||
Game 17 | |||
Average | 37,188 | 104.17% | 2.81% |
*Increase in attendance due to higher capacity for the NY Red Bulls game. CenturyLink Field was increased to 46,000 for this game.
Toronto FC Attendance Update
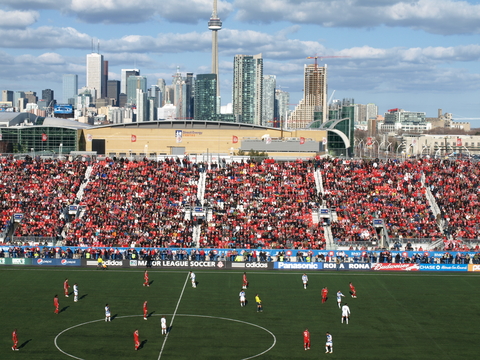
Game | Attendance | Percent Full | % Change from 2010 Attendance |
Game 1 | 20,086 | 92.1% | -1.79% |
Game 2 | 18,968 | 87.0% | -7.26% |
Game 3 | 22,453 | 103.0% | 9.78% |
Game 4 | 16,313 | 74.8% | -20.24% |
Game 5 | 20,147 | 92.4% | -1.50% |
Game 6 | 20,259 | 92.9% | -0.95% |
Game 7 | 18,674 | 85.6% | -8.70% |
Game 8 | 20,122 | 92.3% | -1.62% |
Game 9 | 19,962 | 91.5% | -2.40% |
Game 10 | 21,839 | 100.2% | 6.78% |
Game 11 | 19,816 | 90.9% | -3.11% |
Game 12 | 21,087 | 96.7% | 3.10% |
Game 13 | |||
Game 14 | |||
Game 15 | |||
Game 16 | |||
Game 17 | |||
Average | 19,977 | 91.64% | -2.33% |
Vancouver Whitecaps Attendance Update

Game | Attendance | Percent Full | Percent Change Since 2010 |
Game 1 | 22,592 | 110.2% | --- |
Game 2 | 20,518 | 100.0% | --- |
Game 3 | 19,396 | 94.6% | --- |
Game 4 | 20,809 | 101.5% | --- |
Game 5 | 21,000 | 102.4% | --- |
Game 6 | 15,608 | 76.1% | --- |
Game 7 | 15,474 | 75.5% | --- |
Game 8 | 21,000 | 102.4% | --- |
Game 9 | 20,168 | 98.4% | --- |
Game 10 | 19,079 | 93.1% | --- |
Game 11 | 27,500* | 134.1% | --- |
Game 12 | --- | ||
Game 13 | --- | ||
Game 14 | --- | ||
Game 15 | --- | ||
Game 16 | --- | ||
Game 17 | --- | ||
Average | 20,286 | 98.96% | --- |
Sunday, July 31, 2011
Week 20 MLS Attendance Update
| Team | Attendance | Capacity | Percent Full | Last Year's Average Attendance |
| Chicago Fire | 14,292 | 20,000 | 71.46% | 15,814 |
| Chivas USA | 14,425 | 27,000 | 53.43% | 14,575 |
| Colorado Rapids | 14,402 | 18,086 | 79.63% | 13,328 |
| Columbus Crew | 10,882 | 20,455 | 53.20% | 14,641 |
| DC United | 15,361 | 23,865 | 64.37% | 14,531 |
| FC Dallas | 13,067 | 21,193 | 61.66% | 10,815 |
| Houston Dynamo | 17,032 | 25,462 | 66.89% | 17,309 |
| Los Angeles Galaxy | 22,829 | 27,000 | 84.55% | 21,436 |
| New England Revolution | 12,149 | 22,385 | 54.27% | 12,986 |
| New York Red Bulls | 18,216 | 25,189 | 72.32% | 18,441 |
| Philadelphia Union | 18,236 | 18,500 | 98.57% | 19,254 |
| Portland Timbers | 18,627 | 18,627 | 100.0% | --- |
| Real Salt Lake | 16,689 | 20,008 | 83.41% | 17,095 |
| San Jose Earthquakes | 12,395 | 10,300 | 120.34% | 9,659 |
| Seattle Sounders | 37,188 | 35,700 | 104.17% | 36,173 |
| Sporting Kansas City | 17,762 | 18,467 | 96.18% | 10,287 |
| Toronto FC | 19,977 | 21,800 | 91.64% | 20,453 |
| Vancouver Whitecaps | 20,286 | 20,500 | 98.96% | --- |
| Average | 17,411 | 21,919 | 79.43% | 16,675 |
Monday, July 25, 2011
Week 19 MLS Attendance
| Team | Attendance | Capacity | Percent Full | Last Year's Average Attendance |
| Chicago Fire | 14,292 | 20,000 | 71.46% | 15,814 |
| Chivas USA | 14,425 | 27,000 | 53.43% | 14,575 |
| Colorado Rapids | 14,402 | 18,086 | 79.63% | 13,328 |
| Columbus Crew | 10,882 | 20,455 | 53.20% | 14,641 |
| DC United | 15,361 | 23,865 | 64.37% | 14,531 |
| FC Dallas | 13,344 | 21,193 | 62.96% | 10,815 |
| Houston Dynamo | 16,902 | 25,462 | 66.38% | 17,309 |
| Los Angeles Galaxy | 22,829 | 27,000 | 84.55% | 21,436 |
| New England Revolution | 12,149 | 22,385 | 54.27% | 12,986 |
| New York Red Bulls | 18,216 | 25,189 | 72.32% | 18,441 |
| Philadelphia Union | 18,177 | 18,500 | 98.25% | 19,254 |
| Portland Timbers | 18,627 | 18,627 | 100.0% | --- |
| Real Salt Lake | 16,523 | 20,008 | 82.58% | 17,095 |
| San Jose Earthquakes | 12,565 | 10,300 | 121.99% | 9,659 |
| Seattle Sounders | 37,188 | 35,700 | 104.17% | 36,173 |
| Sporting Kansas City | 17,820 | 18,467 | 96.49% | 10,287 |
| Toronto FC | 19,977 | 21,800 | 91.64% | 20,453 |
| Vancouver Whitecaps | 19,564 | 20,500 | 95.44% | --- |
| Average | 17,408 | 21,919 | 79.42% | 16,675 |
Sunday, July 17, 2011
Week 18 Attendance Update
| Team | Attendance | Capacity | Percent Full | Last Year's Average Attendance |
| Chicago Fire | 14,292 | 20,000 | 71.46% | 15,814 |
| Chivas USA | 14,735 | 27,000 | 54.58% | 14,575 |
| Colorado Rapids | 14,532 | 19,680 | 73.84% | 13,328 |
| Columbus Crew | 10,846 | 20,455 | 53.02% | 14,641 |
| DC United | 15,338 | 45,596 | 33.64% | 14,531 |
| FC Dallas | 13,344 | 21,193 | 62.96% | 10,815 |
| Houston Dynamo | 16,902 | 32,350 | 52.25% | 17,309 |
| Los Angeles Galaxy | 22,641 | 27,000 | 83.86% | 21,436 |
| New England Revolution | 12,149 | 22,385 | 54.27% | 12,986 |
| New York Red Bulls | 18,310 | 25,189 | 72.69% | 18,441 |
| Philadelphia Union | 18,177 | 18,500 | 98.25% | 19,254 |
| Portland Timbers | 18,627 | 18,627 | 100.0% | --- |
| Real Salt Lake | 16,233 | 20,008 | 81.13% | 17,095 |
| San Jose Earthquakes | 13,010 | 10,300 | 126.31% | 9,659 |
| Seattle Sounders | 37,188 | 35,700 | 104.17% | 36,173 |
| Sporting Kansas City | 18,107 | 18,467 | 98.05% | 10,287 |
| Toronto FC | 19,876 | 23,000 | 86.42% | 20,453 |
| Vancouver Whitecaps | 19,564 | 20,000 | 97.82% | --- |
| Average | 17,515 | 23,636 | 74.10% | 16,675 |
Monday, July 11, 2011
Week 17 Attendance Update
| Team | Attendance | Capacity | Percent Full | Last Year's Average Attendance |
| Chicago Fire | 14,026 | 20,000 | 70.13% | 15,814 |
| Chivas USA | 14,725 | 27,000 | 54.54% | 14,575 |
| Colorado Rapids | 14,532 | 19,680 | 73.84% | 13,328 |
| Columbus Crew | 10,483 | 20,455 | 51.25% | 14,641 |
| DC United | 15,338 | 45,596 | 33.64% | 14,531 |
| FC Dallas | 13,598 | 21,193 | 64.16% | 10,815 |
| Houston Dynamo | 17,387 | 32,350 | 53.75% | 17,309 |
| Los Angeles Galaxy | 22,641 | 27,000 | 83.86% | 21,436 |
| New England Revolution | 12,008 | 22,385 | 53.64% | 12,986 |
| New York Red Bulls | 18,310 | 25,189 | 72.69% | 18,441 |
| Philadelphia Union | 18,177 | 18,500 | 98.25% | 19,254 |
| Portland Timbers | 18,627 | 18,627 | 100.0% | --- |
| Real Salt Lake | 16,233 | 20,008 | 81.13% | 17,095 |
| San Jose Earthquakes | 13,010 | 10,300 | 126.31% | 9,659 |
| Seattle Sounders | 37,264 | 35,700 | 104.38% | 36,173 |
| Sporting Kansas City | 18,107 | 18,467 | 98.05% | 10,287 |
| Toronto FC | 19,876 | 23,000 | 86.42% | 20,453 |
| Vancouver Whitecaps | 19,564 | 20,000 | 97.82% | --- |
| Average | 17,542 | 23,636 | 74.22% | 16,675 |
Wednesday, July 6, 2011
Week 16 Attendance Update
| Team | Attendance | Capacity | Percent Full | Percent Change Since 2010 |
| Chicago Fire | 14,026 | 20,000 | 70.13% | -11.30% |
| Chivas USA | 15,314 | 27,000 | 56.72% | 5.07% |
| Colorado Rapids | 14,696 | 19,680 | 74.68% | 10.27% |
| Columbus Crew | 10,483 | 20,455 | 51.25% | -28.40% |
| DC United | 15,338 | 45,596 | 33.64% | 5.55% |
| FC Dallas | 13,598 | 21,193 | 64.16% | 15.73% |
| Houston Dynamo | 17,198 | 32,350 | 53.16% | -0.64% |
| Los Angeles Galaxy | 22,739 | 27,000 | 84.22% | 6.08% |
| New England Revolution | 12,008 | 22,385 | 53.64% | -7.53% |
| New York Red Bulls | 18,204 | 25,189 | 72.27% | -1.29% |
| Philadelphia Union | 18,177 | 18,500 | 98.25% | -5.60% |
| Portland Timbers | 18,627 | 18,627 | 100.0% | --- |
| Real Salt Lake | 16,066 | 20,008 | 80.30% | -6.02% |
| San Jose Earthquakes | 13,367 | 10,300 | 129.78% | 38.39% |
| Seattle Sounders | 37,264 | 35,700 | 104.38% | 3.02% |
| Sporting Kansas City | 18,953 | 18,467 | 102.63% | 84.24% |
| Toronto FC | 19,876 | 23,000 | 86.42% | -2.82% |
| Vancouver Whitecaps | 19,618 | 20,000 | 98.09% | --- |
| Average | 17,610 | 23,636 | 74.50% | 5.61% |
Monday, June 27, 2011
Week 15 Attendance Update
| Team | Attendance | Capacity | Percent Full | Percent Change Since 2010 |
| Chicago Fire | 14,026 | 20,000 | 70.13% | -11.30% |
| Chivas USA | 15,334 | 27,000 | 56.79% | 5.21% |
| Colorado Rapids | 14,258 | 19,680 | 72.45% | 6.98% |
| Columbus Crew | 10,483 | 20,455 | 51.25% | -28.40% |
| DC United | 15,557 | 45,596 | 34.12% | 7.06% |
| FC Dallas | 12,808 | 21,193 | 60.44% | 18.43% |
| Houston Dynamo | 17,198 | 32,350 | 53.16% | -0.64% |
| Los Angeles Galaxy | 22,206 | 27,000 | 82.24% | 3.59% |
| New England Revolution | 12,008 | 22,385 | 53.64% | -7.53% |
| New York Red Bulls | 18,204 | 25,189 | 72.27% | -1.29% |
| Philadelphia Union | 18,177 | 18,500 | 98.25% | -5.60% |
| Portland Timbers | 18,627 | 18,627 | 100.0% | --- |
| Real Salt Lake | 16,057 | 20,008 | 80.25% | -6.07% |
| San Jose Earthquakes | 9,909 | 10,300 | 96.21% | 2.59% |
| Seattle Sounders | 37,264 | 35,700 | 104.38% | 3.02% |
| Sporting Kansas City | 18,953 | 18,467 | 102.63% | 84.24% |
| Toronto FC | 19,882 | 23,000 | 86.44% | -2.79% |
| Vancouver Whitecaps | 19,618 | 20,000 | 98.09% | --- |
| Average | 17,400 | 23,636 | 73.61% | 4.35% |
The attendance for the Gold Cup Final at the Rose Bowl was 93,420.
As most of you know, Mexico won 4-2.

Subscribe to:
Posts (Atom)