Monday, March 26, 2012

Week 3 Attendance Update

  A General View Of The Match Between The New York Red Bulls And The Colorado Rapids At Red Bull Arena On March 25,
The New York Red Bulls had their home opener this weekend and beat the Colorado Rapids 4-1 with 2 goals a piece from Thierry Henry and Kenny Cooper 

Team Attendance Capacity Percent Full Last Year's Average Attendance
Chicago Fire 18,075 20,000 90.38% 14,274 
Chivas USA 11,094 27,000 41.09% 14,830 
Colorado Rapids 14,746 18,087 81.53% 14,838 
Columbus Crew 18,197 20,145 90.33% 12,185 
DC United 16,314 23,865 68.36% 15,211 
FC Dallas16,555 21,193 78.11%
12,861 
Houston Dynamo
22,000 % 17,694 
Los Angeles Galaxy 22,733 27,000 84.20% 23,335 
Montreal Impact 58,912 20,341 289.62% ---
NE Revolution 12,925 22,385 57.74% 13,222 
New York Red Bulls 21,024 25,189 83.47% 19,691 
Philadelphia Union 19,074 18,500 103.10% 18,258
Portland Timbers 20,438 20,323 100.57% 18,827 
Real Salt Lake 18,577 20,008 92.85% 17,594 
San Jose Earthquakes 16,171 10,300 157.00% 11,858 
Seattle Sounders 38,507 38,500 100.02% 38,495 
Sporting Kansas City 17,469 18,467 94.60% 17,810 
Toronto FC 20,070 21,800 92.06% 20,267
Vancouver Whitecaps 20,197 21,500 93.94% 20,406 
Average 20,861 21,926 95.14% 17,870

Tuesday, March 20, 2012

Week 2 Attendance Update

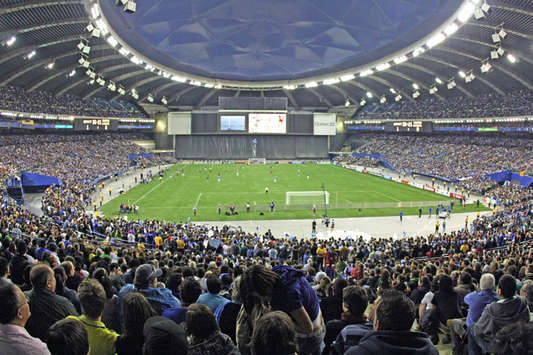
The Montreal Impact had a mammoth crowd of 58,912 in Olympic Stadium for the first ever home game for the club. 

San Jose played a game this past week at AT&T Park, home of the San Francisco Giants and saw over 20,000 in attendance. It should also be noted that Toronto drew in over 40,000 for their Champions League match-up with the LA Galaxy (though this does not show up on this graph). Chivas USA had their second home game and recorded an attendance of only 7,723. It may be time to move this club to San Diego.

Team Attendance Capacity Percent Full Last Year's Average Attendance
Chicago Fire
20,000 % 14,274 
Chivas USA 11,094 27,000 41.09% 14,830 
Colorado Rapids 14,746 18,087 81.53% 14,838 
Columbus Crew
20,145 % 12,185 
DC United 16,314 23,865 68.36% 15,211 
FC Dallas16,555 21,193 78.11%
12,861 
Houston Dynamo
22,000 % 17,694 
Los Angeles Galaxy 22,733 27,000 84.20% 23,335 
Montreal Impact 58,912 20,341 289.62% ---
NE Revolution
22,385 % 13,222 
New York Red Bulls
25,189 % 19,691 
Philadelphia Union 19,074 18,500 103.10% 18,258
Portland Timbers 20,438 20,323 100.57% 18,827 
Real Salt Lake 16,738 20,008 83.66% 17,594 
San Jose Earthquakes 16,171 10,300 157.00% 11,858 
Seattle Sounders 38,709 38,500 100.54% 38,495 
Sporting Kansas City 19,777 18,467 107.09% 17,810 
Toronto FC
21,800 % 20,267
Vancouver Whitecaps 21,000 21,500 97.67% 20,406 
Average 21,107 21,926 96.26% 17,870

Tuesday, March 13, 2012

MLS Starts Again! Week 1 Attendance

A new year of MLS soccer, year 17. Last year was the highest gate attendance and highest average attendance ever in MLS history.

SeasonTotal GateGamesAvg.High avg.TeamLow avg.Team
19962,785,00116017,40628,916Los Angeles Galaxy10,213Colorado Rapids 
19972,339,01916014,61921,423NE Revolution9,058Kansas City Wizards
19982,747,89719214,31221,784Los Angeles Galaxy 8,072Kansas City Wizards 
19992,742,10219214,28217,696Columbus Crew8,183Kansas City Wizards 
20002,641,08519213,75620,400Los Angeles Galaxy 7,460Miami Fusion
20012,363,85915814,96121,518D.C. United9,112Kansas City Wizards 
20022,215,01914015,82220,690Colorado Rapids11,150San Jose Earthquakes
20032,234,74715014,89821,983Los Angeles Galaxy 7,906Dallas Burn
20042,333,79715015,55923,809Los Angeles Galaxy 9,088Dallas Burn
20052,900,71619215,10824,204Los Angeles Galaxy 9,691Kansas City Wizards 
20062,976,78719215,50420,814Los Angeles Galaxy 11,083Kansas City Wizards 
20073,270,21019516,77024,252Los Angeles Galaxy 11,586Kansas City Wizards 
20083,456,60021016,46026,008Los Angeles Galaxy 10,685Kansas City Wizards 
20093,608,32522516,03730,942Seattle Sounders FC9,883FC Dallas
20104,002,00024016,67536,173Seattle Sounders FC 9,659San Jose Earthquakes 
20115,468,95130617,87038,496Seattle Sounders FC 11,858San Jose Earthquakes 
(sorry I am terrible at HTML)

We have a new team. Montreal is added to the mix and sure to add an increase in attendance as every Canadian club has.


We have new stadiums for Vancouver (only used BC Place a couple times last year)and the Houston Dynamo in BBVA Compass Stadium. Both stadiums are beautiful and will only increase the attendance and excitement for MLS soccer in both of these cities.


Meanwhile Portland and Seattle, in the new heartland of MLS, both increased capacity at their stadiums as the Cascada region continues to amaze Don Garber and the MLS.


This year looks to be a another great year for the MLS as a league and in attendance. As long as all the new expansion teams can keep their high attendance up and keep their team the talk of the town, the MLS could break 19,000 for average attendance. The original teams look to increase attendance and copy the set up now seen in Canada, Seattle, Portland, and others. With no team planned to join in 2013, the fans and league must focus on building up and maintaining the MLS to a high standard. I have no doubts that this league can grow to be one of the best in the world.

Eight games were played this weekend and here is the attendance for those as the MLS kicks off.

Team Attendance Capacity Percent Full Last Year's Average Attendance
Chicago Fire
20,000 % 14,274 
Chivas USA 14,464 27,000 53.57% 14,830 
Colorado Rapids 14,746 18,087 81.53% 14,838 
Columbus Crew
20,145 % 12,185 
DC United 16,314 23,865 68.36% 15,211 
FC Dallas20,906 21,193 98.65%
12,861 
Houston Dynamo
22,000 % 17,694 
Los Angeles Galaxy 27,000 27,000 100.0% 23,335 
Montreal Impact
20,341 % ---
NE Revolution
22,385 % 13,222 
New York Red Bulls
25,189 % 19,691 
Philadelphia Union
18,500 % 18,258
Portland Timbers 20,438 20,323 100.57% 18,827 
Real Salt Lake
20,008 % 17,594 
San Jose Earthquakes 10,525 10,300 102.18% 11,858 
Seattle Sounders
38,500 % 38,495 
Sporting Kansas City
18,467 % 17,810 
Toronto FC
21,800 % 20,267
Vancouver Whitecaps 21,000 21,500 97.67% 20,406 
Average 18,174 21,926 82.89% 17,870

Monday, October 24, 2011

Final Attendance Update

Comment if you want a specific team's week by week attendance for all 17 home games. I also have all historical of teams since 1996.

The only teams to have a decrease in average attendance were Chicago, Columbus, Philadelphia, and Toronto. Philadelphia had a decrease due to playing a couple games last year at Lincoln Financial and having attendance of over 25,000. The Portland Timbers and Seattle Sounders both increased capacity for a few games resulting in a percent full stadium over 100%. The San Jose Earthquakes played at Stanford Stadium for a game on July 4th weekend and drew 41,028 fans resulting in an increase in attendance.

The Houston Dynamo and the Montreal Impact will both have soccer specific stadiums next year. San Jose will have a soccer specific stadium complete in 2013. DC United and NE Revolution have no plans for soccer specific stadiums. Vancouver will play all games at BC Place next year with expandable seating. Montreal will also play higher priority games in the larger Olympic Stadium next year. More analysis to come.
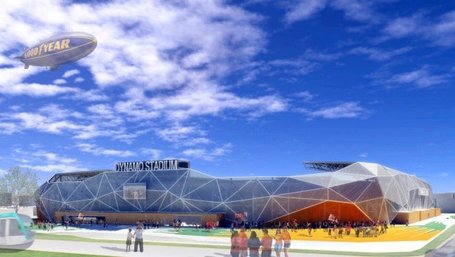
Houston Dynamo's new stadium for next year.


Team Attendance Capacity Percent Full Last Year's Average Attendance
Chicago Fire 14,274 20,000 71.37% 15,814
Chivas USA 14,830 27,000 54.92% 14,575
Colorado Rapids 14,838 18,086 82.04% 13,328
Columbus Crew 12,185 20,455 59.57% 14,641
DC United 15,211 23,865 63.74% 14,531
FC Dallas 12,861 21,193 60.68%
10,815
Houston Dynamo 17,694 25,462 69.49% 17,309
Los Angeles Galaxy 23,335 27,000 86.43% 21,436
New England Revolution 13,222 22,385 59.07% 12,986
New York Red Bulls 19,691 25,189 78.17% 18,441
Philadelphia Union 18,258 18,500 98.69% 19,254
Portland Timbers 18,827 18,627 101.07% ---
Real Salt Lake 17,594 20,008 87.94% 17,095
San Jose Earthquakes 11,858 10,300 115.13% 9,659
Seattle Sounders 38,495 35,700 107.83% 36,173
Sporting Kansas City 17,810 18,467 96.44% 10,287
Toronto FC 20,267 21,800 92.97% 20,453
Vancouver Whitecaps 20,406 20,500 99.54% ---
Average 17,870 21,919 81.53% 16,675

Monday, October 10, 2011

Week 30 MLS Attendance Update


Team Attendance Capacity Percent Full Last Year's Average Attendance
Chicago Fire 14,137 20,000 70.69% 15,814
Chivas USA 14,373 27,000 53.23% 14,575
Colorado Rapids 14,749 18,086 81.55% 13,328
Columbus Crew 12,185 20,455 59.57% 14,641
DC United 14,907 23,865 62.47% 14,531
FC Dallas 13,087 21,193 61.75%
10,815
Houston Dynamo 16,924 25,462 66.47% 17,309
Los Angeles Galaxy 23,106 27,000 85.58% 21,436
New England Revolution 13,030 22,385 58.21% 12,986
New York Red Bulls 19,356 25,189 76.84% 18,441
Philadelphia Union 18,201 18,500 98.38% 19,254
Portland Timbers 18,733 18,627 100.57% ---
Real Salt Lake 17,420 20,008 87.07% 17,095
San Jose Earthquakes 11,928 10,300 115.80% 9,659
Seattle Sounders 36,893 35,700 103.34% 36,173
Sporting Kansas City 17,678 18,467 95.73% 10,287
Toronto FC 20,184 21,800 92.59% 20,453
Vancouver Whitecaps 20,262 20,500 98.84% ---
Average 17,638 21,919 80.47% 16,675

Sunday, September 25, 2011

Full MLS Attendance Update


Team Attendance Capacity Percent Full Last Year's Average Attendance
Chicago Fire 14,137 20,000 70.69% 15,814
Chivas USA 14,255 27,000 52.80% 14,575
Colorado Rapids 14,804 18,086 81.85% 13,328
Columbus Crew 11,974 20,455 58.54% 14,641
DC United 14,907 23,865 62.47% 14,531
FC Dallas 13,087 21,193 61.75%
10,815
Houston Dynamo 16,882 25,462 66.30% 17,309
Los Angeles Galaxy 22,846 27,000 84.62% 21,436
New England Revolution 12,739 22,385 56.91% 12,986
New York Red Bulls 18,967 25,189 75.30% 18,441
Philadelphia Union 18,217 18,500 98.47% 19,254
Portland Timbers 18,733 18,627 100.57% ---
Real Salt Lake 17,197 20,008 85.95% 17,095
San Jose Earthquakes 12,021 10,300 116.71% 9,659
Seattle Sounders 36,932 35,700 103.45% 36,173
Sporting Kansas City 17,668 18,467 95.67% 10,287
Toronto FC 20,187 21,800 92.60% 20,453
Vancouver Whitecaps 20,220 20,500 98.64% ---
Average 17,535 21,919 80.00% 16,675